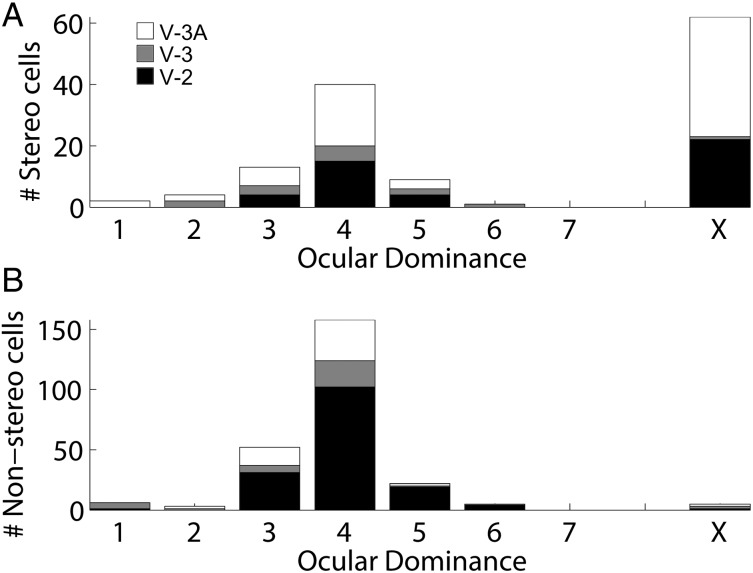
Figure 10.
Responses to monocular versus binocular stimulation. (A) Population distribution of disparity-tuned neurons. Values of “1” correspond to neurons whose responses were entirely driven by the left eye; “7,” correspond to neurons whose responses were entirely driven by the right eye; and “4,” by both eyes equally. Obligate binocular cells, which require simultaneous stimulation of both eyes, are shown in column “X.” (B) Distribution of nondisparity-tuned neurons.

