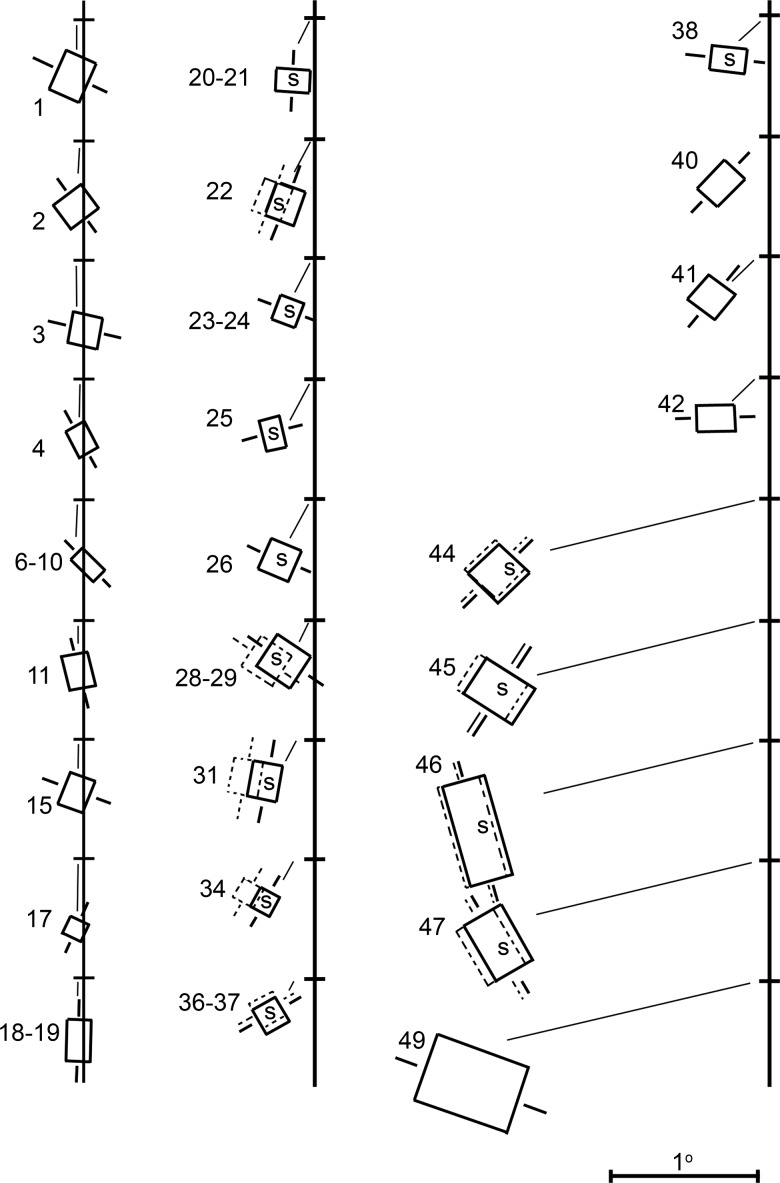
Figure 6.
Reconstruction of the receptive-field maps for all the neurons encountered on the experiment conducted on 24 June 1969 (see Figs 2 and 3). “S” indicates disparity-tuned (“stereo”) neurons. The horizontal tick marks along the vertical line show the center of gaze. The receptive fields have been splayed out along the vertical axis, so that individual overlapping receptive fields can be easily discriminated. See also Supplementary Figures 3 and 4.

