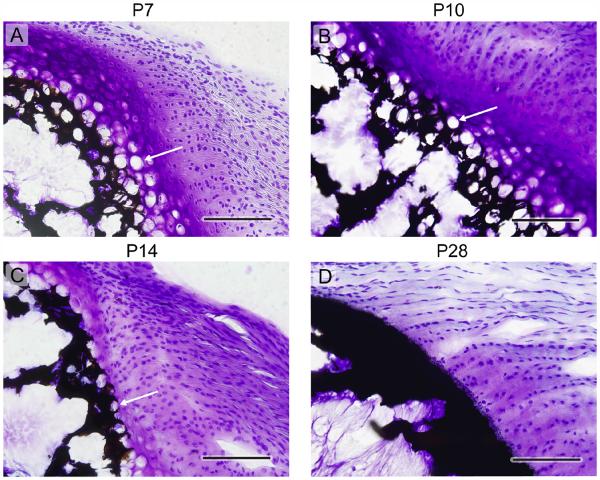
Figure 3.
Histologic tissue sections of the tendon-to-bone enthesis at the rotator cuff of a mouse, showing a steady decline in the size and volume fraction of chondrocytes with age. Time points: (a) P7, (b) P10, (c) P14, (d) P28. The black/dark areas indicate mineral, the cell nuclei are stained with dark blue, hypertrophic chondrocytes appear as white circles (see arrows in (a), (b), and (c)), and the purplish/pinkish areas indicate the presence of proteoglycans, which are characteristic of cartilage. Note that the cells remain spherical throughout, and start to organize into columns at later timepoints. Although Raman spectroscopic analysis clearly indicates a gradient in mineral at all timepoints (Schwartz et al. 2012; Wopenka et al. 2008), the graded transition zone is not visible by von Kossa staining at any timepoint, as this staining yields an opaque band with even a small level of mineralization. (5 μm thick sections, von Kossa and Toluidine blue staining, scale bar = 100μm, arrows: hypertrophic chondrocytes).

