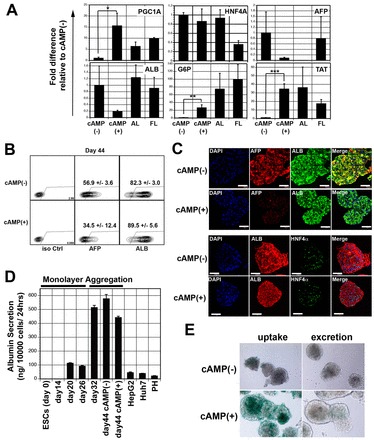
Fig. 4.

cAMP induces maturation of hESC-derived hepatocyte-like cells. (A) RT-qPCR-based expression analysis of indicated genes in hepatic aggregates cultured in the presence and absence of 8-Br-cAMP. Values are determined relative to TBP and presented as fold change relative to expression of the non-treated cells which is set at 1. AL (adult liver): n=2, AL1, AL2. FL (fetal liver): n=2, FL1, FL2. (B) Intracellular flow cytometric analysis showing the proportion of α-fetoprotein (AFP)+ and albumin (ALB)+ cells (day 44) in hepatic aggregates cultured in the presence and absence of 8-Br-cAMP. The number of AFP+ cells was significantly lower in the population induced with cAMP compared with the non-induced population (34.5±12.4% versus 56.9±3.6%, P<0.05, mean±s.d., n=3), whereas the proportion of ALB+ cells was higher in the treated population [89.5±5.6% versus 82.3±3.0%, P<0.05 (mean±s.d., n=3)]. (C) Confocal microscopic images showing co-expression of ALB and AFP or ALB and HNF4α in day 44 aggregates cultured in the presence and absence of 8-Br-cAMP. In the upper panel, albumin is visualized by Alexa 488 (green), AFP by Cy3 (red) and the nuclei by DAPI (blue). In the lower panel, albumin is visualized by Cy3 (red), HNF4α by Alexa 488 (green) and the nuclei by DAPI (blue). Scale bars: 50 μm. (D) The levels of albumin (ALB) secreted by hESC-derived monolayer and aggregate populations, as well as by HepG2 cells, Huh7 cells and cryopreserved hepatocytes (PH, lot OSI). Secretion was detected using an ELISA assay. (E) ICG uptake and release by cAMP-treated and non-treated day 44 aggregates. Error bars in all graphs represent the s.d. of the mean of the values from three independent experiments. *P<0.05, **P<0.01, ***P<0.001, Student’s t-test,
