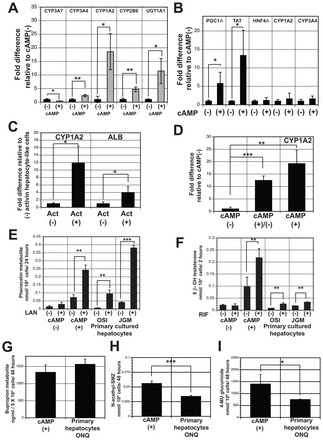
Fig. 5.

cAMP increases metabolic enzyme activity in hESC-derived hepatocytes. (A) RT-qPCR analysis showing expression of indicated genes in hepatic aggregates (day 44) cultured in the presence and absence of 8-Br-cAMP. Values are determined relative to TBP and presented as fold change relative to expression in non-treated cells, which is set at 1. (B) RT-qPCR analyses showing expression of indicated genes in untreated (-) and cAMP-treated (+) monolayer populations (day 44). Values are determined relative to TBP and presented as fold change relative to expression in non-treated cells, which is set at 1. (C) RT-qPCR analyses of CYP1A2 and ALB expression in cAMP-treated aggregates (day 44) generated from non-treated (-Act) or extended activin treated (+Act) endoderm. (D) RT-qPCR analyses of CYP1A2 expression in aggregates cultured for 6 (cAMP+/-) or 12 days in 8-Br-cAMP (cAMP+). (E) hESC-derived hepatic cells display lansoprazole (LAN)-inducible CYP1A2 activity in vitro. Generation of the O-de-ethylated metabolite acetaminophen from phenacetin was monitored by HPLC. Activity is presented per 10,000 cells. Non-induced cells (-) were cultured in 0.1% DMSO-containing medium (n=3). (F) hESC-derived hepatic cells display rifampicin (RIF)-inducible CYP3A4 activity in vitro. Generation of the 6β-hydroxytestosterone from testosterone was monitored by HPLC. Activity is presented per 10,000 cells. Non-induced cells (-) were cultured in 0.1% DMSO-containing medium (n=3). (G) hESC-derived hepatic cells display CYP2B6 activity in vitro. Formation of the metabolite O-hydroxy-bupropion from bupropion was measured by HPLC. Activity is presented per 50,000 cells (n=3). (H) Metabolism of sulfamethazine (SMZ) to N-acetylated SMZ indicates the presence of the Phase II enzyme(s) NAT2 and/or NAT1. Activity is presented per 10,000 cells (n=3). (I) HPLC analysis showing generation of 4-MU glucuronide (4-MUG) from 4-methylumbelliferone (4-MU) by the cAMP-treated aggregates indicative of total UGT activity. Activity is presented per 10,000 cells (n=3). Error bars in all graphs represent the s.d. of the mean of samples from three independent experiments. *P<0.05, **P<0.01, ***P<0.001, Student’s t-test. OSI, JGM and ONQ are three different lots of cultured primary hepatocytes.
