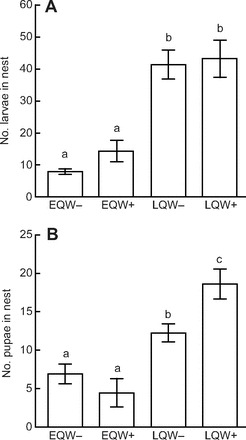
Fig. 3.

Effect of social manipulation on colony development. (A) Effect of treatment on the number of larvae in nests; x-axis, group; y-axis, number of larvae in nests on day 7; 2-way ANOVA with stage of queen and workers as factors: Pstage(d.f.=1)<0.0001, other comparisons N.S. (B) Effect of treatment on number of pupae in nests; x-axis, group; y-axis, number of pupae in nests on day 7; 2-way ANOVA with stage of queen and workers as factors: Pstage(d.f.=1)<0.0001, Pstage×workers(d.f.=1)<0.01. Values shown in A and B are group means ± s.e.m.; letters represent results of pairwise t-tests.
