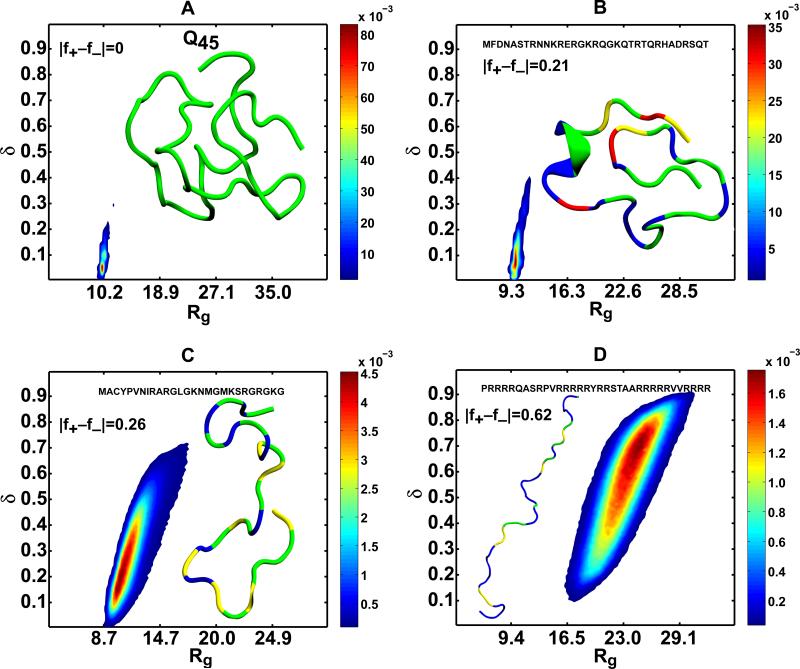
Figure 3. IDPs form globules or coils depending on the net charge per residue (|f+–f−| increases), T=298 K.
Panel (A) shows the joint distribution P(Rg,δ) and a representative conformation for polyglutamine with 45 residues. The distribution highlights the small amplitudes of conformational fluctuations and the overall compactness of the conformations that are sampled by this sequence. Panels (B), (C), and (D) show how arginine-rich sequences transition from globules (B) to theta-like conformations (C) and swollen, ellipsoidal coils (D) as the net charge per residue increases. The figures were generated using the simulation results of Mao et al. (B-D) [146] and Vitalis et al. (A) [137]. The representative conformations were drawn using the VMD package [181] and the color-coding used depicts polar residues in green, hydrophobic residues in yellow, positively charged residues in red, and negatively charged residues in blue.

