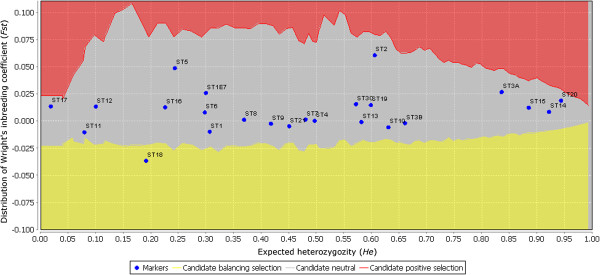
Figure 2.

Detection of outlier SSR loci using the Lositan workbench at the 95% threshold. In red, the confidence area for candidate loci under positive selection; in grey, the confidence area for neutral loci; in yellow, the confidence area for candidate loci potentially under balancing selection. The names of the loci are indicated close to their position on the chart.
