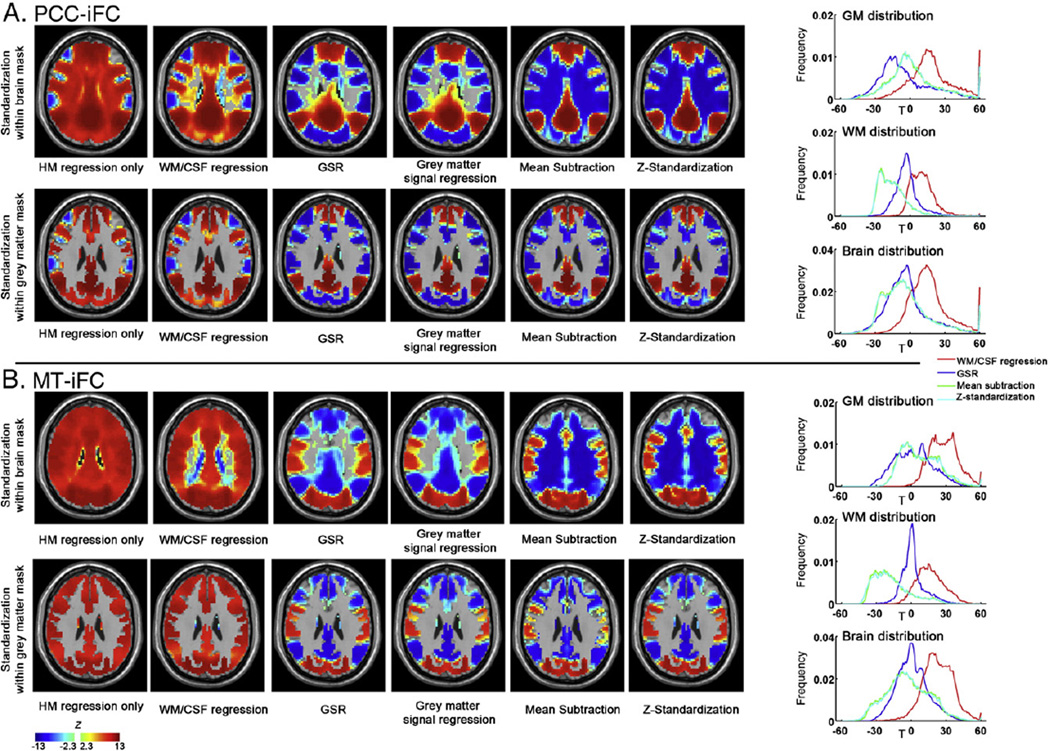
Fig. 8.
The impact on group mean effects of within-subject standardization procedures for PCC-iFC (A) and MT-iFC (B). The MT seed is centered at [−47, −69, −3] (and converted from Talairach space to MNI space) as defined in Fox et al. (2009). The standardization was performed within the whole brain mask (upper row) or within the gray matter mask (bottom row) (axial slice on z = 27). The right panel demonstrates the voxel-wise distribution in T values (T values were used to avoid the inaccuracy of transforming extreme T values into Z values) within the gray matter mask (upper row), white matter mask (middle row) and whole brain (bottom row). Of note, the gray matter and white matter masks were specifically eroded for one voxel to avoid the partial voluming issue related to the gray matter/white matter boundary.

