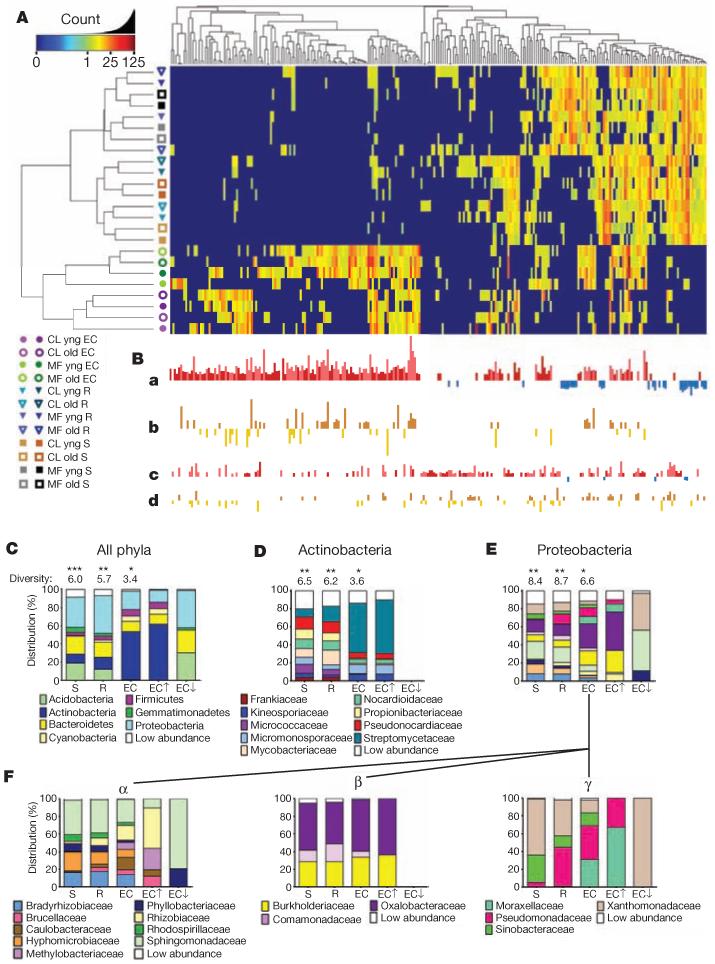
Figure 2. OTUs that differentiate the EC and rhizosphere from soil.
A, Heat map showing OTU counts from the rarefied OTU table (Supplementary Database 2a; log2-transformed) from each of the 256 rhizosphere- and EC-differentiating OTUs present across replicates. Samples and OTUs are clustered on their Bray–Curtis similarities (group-average linkage). The key relates colours to the untransformed read counts. Different hues of the same colour correspond to different replicates as in Fig. 1. B, The strength of GLMM predictions (best linear unbiased predictors) is represented by bar height. a, OTUs predicted as EC enriched (red, up) or EC depleted (blue, down). b, OTUs higher in the EC in Mason Farm soil than Clayton (brown, up) or higher in Clayton soil than Mason Farm (gold, down). OTUs in a that are not differentially affected by soil type are shown there in darker hues. c, OTUs predicted as rhizosphere enriched (as in a). d, OTUs higher in rhizosphere in one soil type (as in b). C, Histograms showing the distributions of phyla present in the 778 measurable OTUs in soil, rhizosphere and ECs compared with phyla present in the subset of EC OTUs enriched (EC↑) or depleted (EC↓) relative to soil. Shannon diversity (considering phyla as individuals) is given above each bar. A differential number of asterisks above the diversity values represents a significant difference (P < 0.05, weighted analysis of variance; Supplementary Methods and Supplementary Table 5). D, Distribution of families present among the OTUs from the phylum Actinobacteria. E, Distribution of families present among the OTUs from the phylum Proteobacteria. F, Distribution of families present among the OTUs of three classes of the phylum Proteobacteria: Alphaproteobacteria (α), Betaproteobacteria (β) and Gammaproteobacteria (γ). Statistical evidence for presence, enrichment in or depletion from EC is in Supplementary Table 6.

