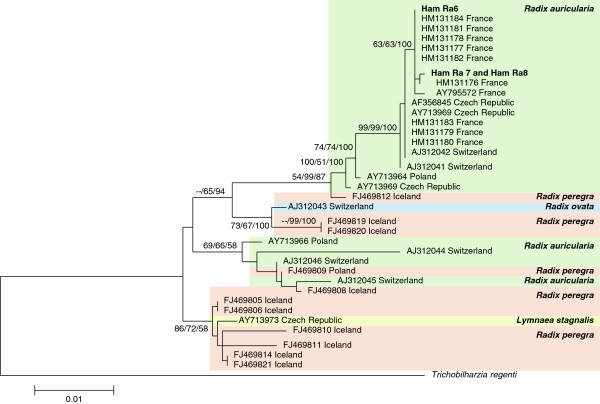
Figure 4.

Phylogenetic tree based on the ITS1 sequences representing different populations of Trichobilharzia franki from European countries and the snail species that they infect. The samples sequenced from Hampshire, UK cluster within a France-specific clade, the only country specific clade to emerge during analysis. The tree was constructed using the ML method in MEGA5 using the K2 + G substitution model. The scale shows the number of nucleotide substitutions per site between DNA sequences and nodal supports were generated using 1000 bootstrap replicates. The nodal support is given in NJ, ML and MP bootstraps respectively and only values >50 for at least two of the analyses are shown.
