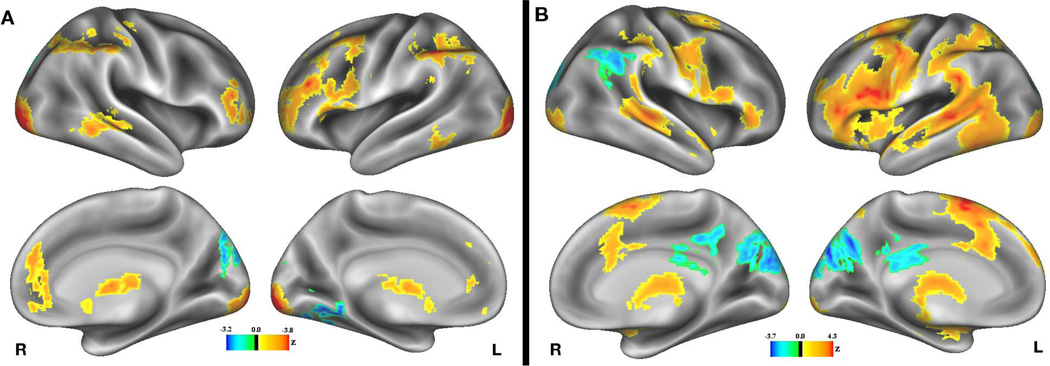
Figure 3.
Group activation contrast showing main effects of value on BOLD signal (A) during the cue period, and (B) during the word encoding period. Warm colors indicate regions showing greater activity on high value trials, and cool colors indicate regions showing greater activity on low value trials. Note that scales were chosen separately for each contrast, and for positive and negative activations within each contrast, to maximize dynamic range, but the actual thresholds were constant across this and all other figures.

