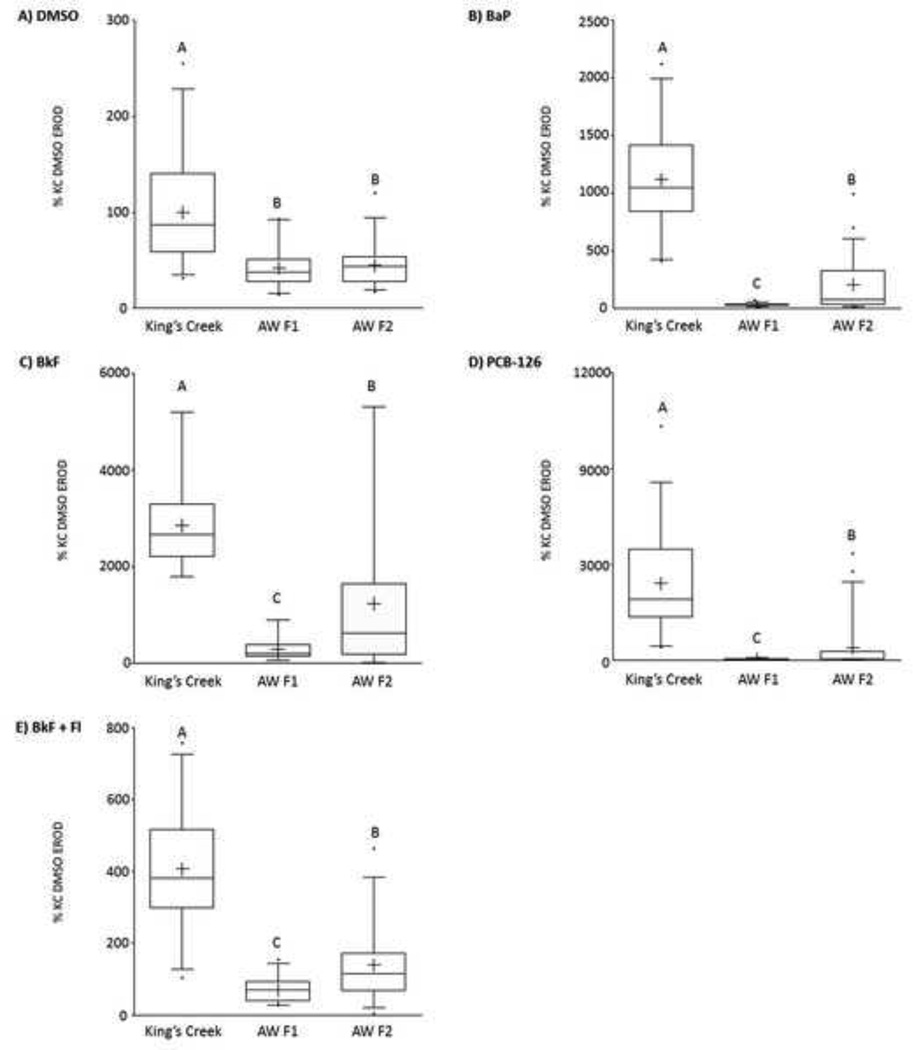
Figure 2. Mean ethoxyresorufin-o-deethylase (EROD) activity of F1 and F2 Atlantic Wood and King’s Creek killifish embryos exposed to aryl hydrocarbons.
Percent of KC DMSO EROD activity for King’s Creek, Atlantic Wood F1, and Atlantic Wood F2 embryos exposed to A) DMSO, B) 100 µg/L benzo[a]pyrene (BaP), C) 300 µg/L benzo[k]fluoranthene (BkF), D) 1 µg/L 3,3’4,4’,5-pentachlorobiphenyl (PCB-126), or E) a mixture of 20 µg/L BkF and 100 µg/L fluoranthene (Fl). Box plots represent median with upper and lower quartiles. Whiskers show the 5th and 95th percentiles. Mean is represented by + and outliers are represented by dots. Within a given panel, groups not marked by the same letter are statistically different at p < 0.05 (ANOVA, Tukey-adjusted LSMeans). n = 30 individuals per treatment group.

