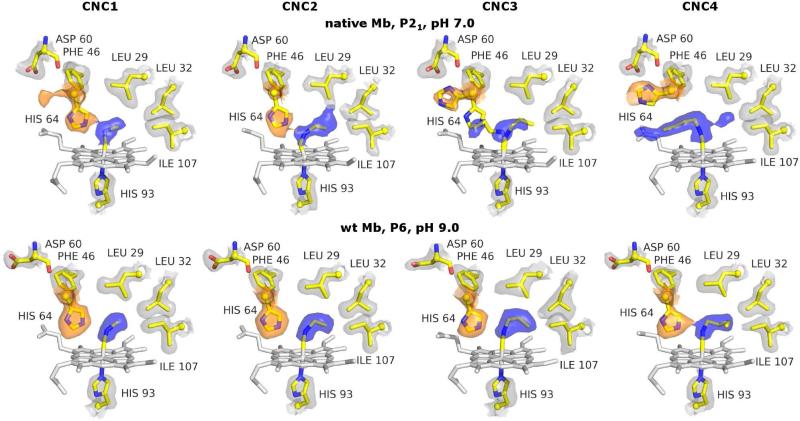
Figure 1.
X-ray crystal structures of native Mb CNC1 through CNC4 (top row) and wt Mb CNC1 through -CNC4 (bottom row). For native Mb, in P21 crystals at pH 7.0, an increase in the isocyanide length corresponds to a greater occupancy of the open conformation of His64 (orange 2Fo-Fc electron density surface) and the out conformation of the ligand (blue 2Fo-Fc electron density surface). However, for wt Mb in P6 crystals at pH 9.0, little conformational variation with CNR chain length is observed. Stick representations show the heme (white) and key amino acid side chains (CPK with yellow carbons) of the refined structures. 2Fo-Fc electron density surfaces are shown in orange, blue, and gray for the His64, ligand, and other side chains, respectively.

