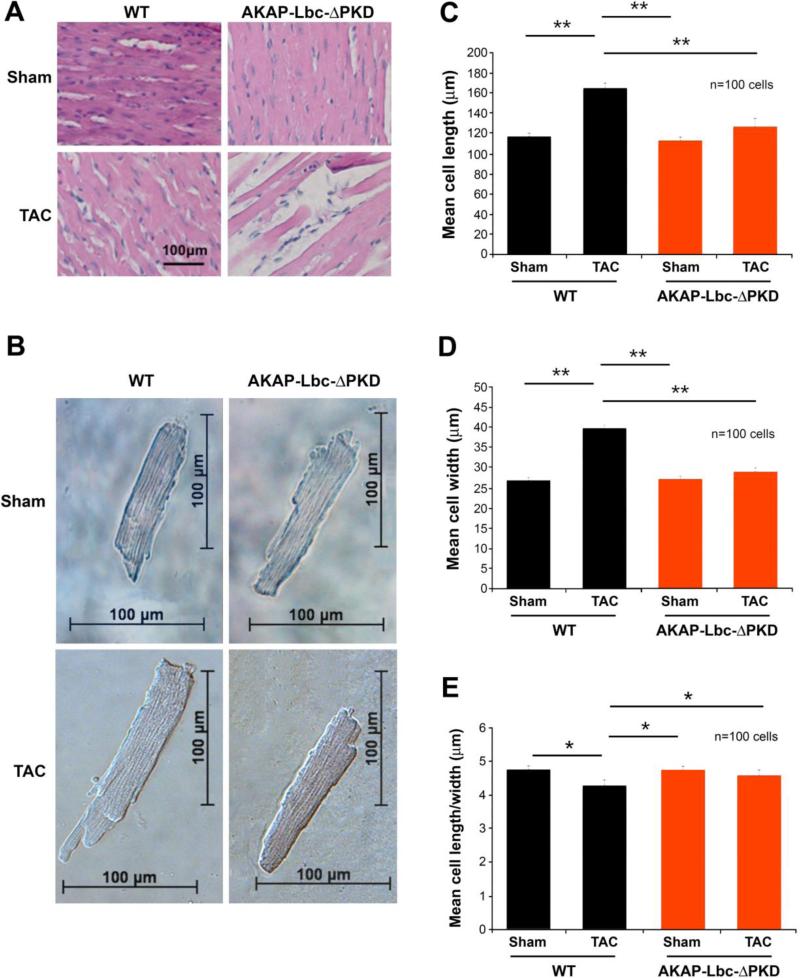
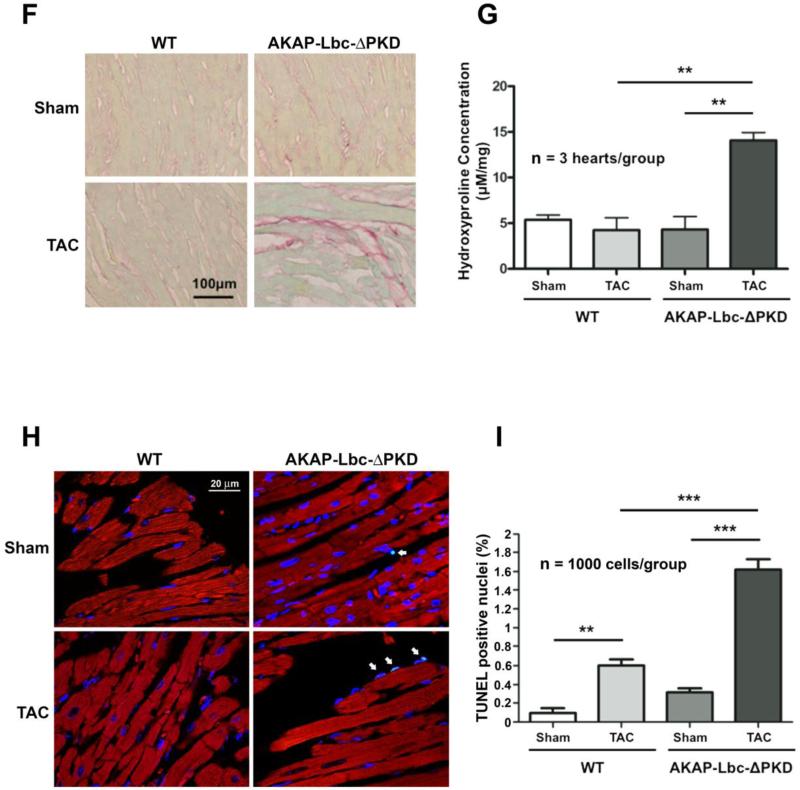
Figure 4. Histological and cellular analysis of WT and AKAP-Lbc-ΔPKD TAC or sham surgery.
A) Hematoxylin-Eosin (HE) staining of LV heart sections from WT and AKAP-Lbc-ΔPKD mice after one month of TAC or sham surgery. HE staining shows no difference in the cytoarchitecture of LV heart from control WT and AKAP-Lbc-ΔPKD mice subjected to sham surgery. In response to TAC, WT mice develop cardiomyocyte hypertrophy, whereas AKAPLbc-ΔPKD hearts present with poor cellularity and elongated, thin, myocytes. (B) Brightfield images of isolated adult cardiac myocytes. Measurement of (C) length (D) width and (E) length/width ratio of isolated myocytes (n=100 cells). Cell length and width are significantly smaller for AKAP-Lbc-ΔPKD/TAC cardiomyocytes compared to WT/TAC cardiomyocytes (**p<0.01). Length width ratio is increased in AKAP-Lbc-ΔPKD/TAC compared to WT/TAC isolated myocytes (*p<0.05). F) AKAP-Lbc-ΔPKD mice + TAC show increased extracellular collagen deposition. Sirius-Red staining indicates increased collagen content in hearts from AKAP-Lbc-ΔPKD mice + TAC, compared to all other groups. G) Quantification of collagen content in hearts from WT and AKAP-Lbc-ΔPKD mice by hydroxyproline (HOP) assay. Results presented show mean HOP content ± SEM. HOP content in AKAP-Lbc-ΔPKD mice + TAC is significantly higher than all other groups (**p < 0.01). All assays were performed using heart samples from 3 different mice for each group. H) Representative images of TUNEL staining carried out using LV heart sections from WT and AKAP-Lbc-ΔPKD mice subjected to sham or TAC surgery. Apoptotic cells (denoted by arrows) are visualized by incorporation of fluoresceindUTP (green) into fragmented DNA. DAPI staining (blue) is used as a marker for cell nuclei. Sections were co-stained with anti-cTnI (red) to help identify cardiac myocytes. I) AKAP-Lbc-ΔPKD mice + TAC display a significant increase in apoptosis compared to WT + TAC (***p < 0.001). Data represent the mean percentage (± SEM) of apoptotic cells (fluorescein-dUTP positive) from 3 mice per group; 1,000 cells total per group. Differences in quantitative variables were examined by ANOVA.


