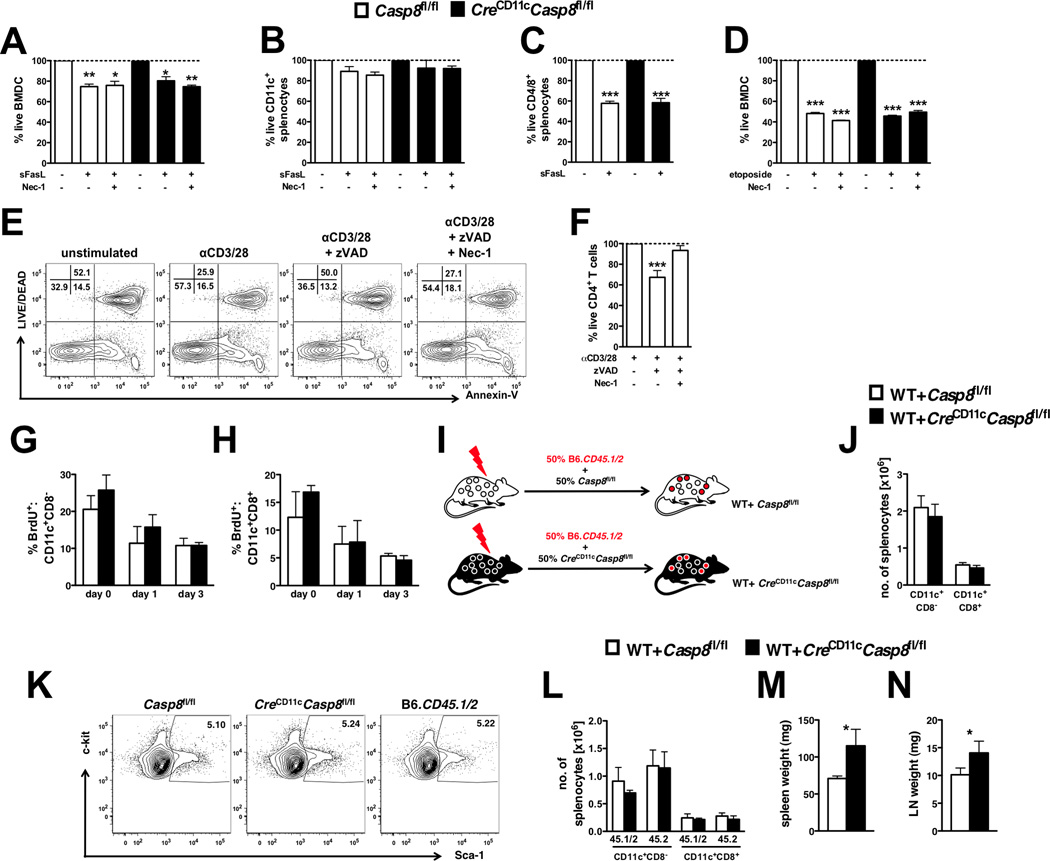
Figure 2. Inflammation related to DC-specific caspase-8 deficiency is independent of DC survival.
Casp8fl/fl (control) and CreCD11cCasp8fl/fl (A) BMDCs (n=4) and (B–C) total splenocytes (n=3) were stimulated with superFasL ± necrostatin-1 (Nec-1) for 10 hours and stained with Annexin-V and Aqua live/dead. Total splenocytes were gated into (B) CD11c+ and (C) CD4/8+ populations for analysis. Additionally, control and CreCD11cCasp8fl/fl BMDCs were stimulated with (D) etoposide for 10 hours and stained with Annexin-V and Aqua live/dead. Data are represented as the percent live compared to unstimulated. (E–F) CD4+ T-cells (n=3) stimulated for 72 hours with αCD3 and αCD28 ± pan-caspase inhibitor zVAD-FMK (zVAD) and Nec-1 were stained with Annexin-V and Aqua live/dead. Data are represented as the percent live compared to αCD3/28 alone. (G–H) Control and CreCD11cCasp8fl/fl mice (n=4) injected with BrdU for 3 days were evaluated for percent splenic BrdU+ (L) CD11c+CD8− and (M) CD11c+CD8+ conventional DCs. (I–M) Mice reconstituted with equal portions of B6.CD45.1/2 (WT) and either control or CreCD11cCasp8fl/fl bone marrow (n=5). (J) Representative Lin−Sca-1+c-kit+ bone marrow cell percentages from 3-month-old female control, CreCD11cCasp8fl/fl and WT mice. Chimeric mice were evaluated 3 months post-transfer for (K) numbers of conventional DCs, (L) distribution of WT (45.1/2) and control or CreCD11cCasp8fl/fl (45.2) derived conventional DCs, (M) splenomegaly and (N) lymphadenopathy. Data are represented as mean ± SD and compared by Mann Whitney test: *, p<0.05; **, p<0.005; ***, p<0.0005.

