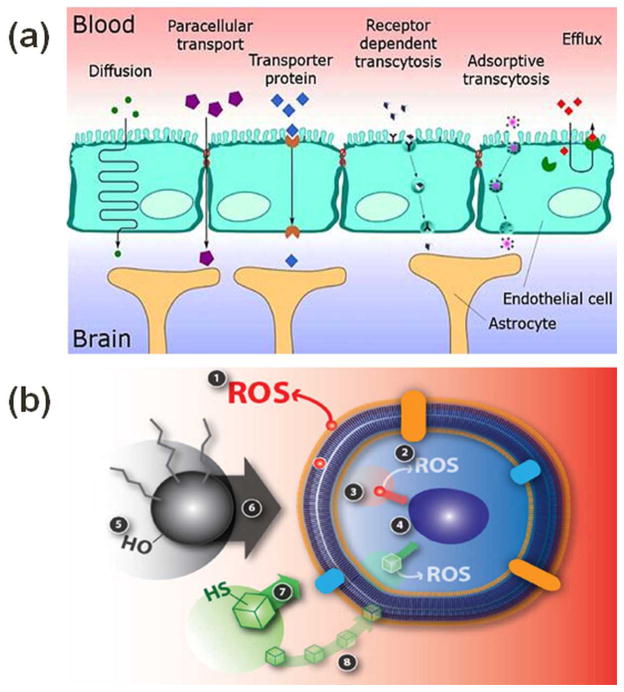
Figure 2.
(a) Illustration of possible pathways in which NPs can cross blood brain barrier. The pathway depends on the material and size of NPs. (b) Illustration of cell-NP interaction and nanotoxicity generation. Event 1 represents the extracellular ROS generation outside and inside the cell. Event 2 represents the damage to the cell membrane integrity. Event 3 is particle dissolution or ion leaching affecting the cell function. Event 4 signifies mechanical damage to intracellular organelles due to NP intrusion. Event 5 is indicating the role of NP surface properties (roughness, charge, and active groups) whereas event 6 is highlighting the role of NP size in toxic effects to a cell. Event 7 is representing the NP shape induced toxicity as different shapes of NP may interact with the cell differently. Event 8 is dissolution or leaching of nanoparticle outside the cell membrane and making it easier to penetrate the cell membrane for nanoparticle and affect the cell function. Figures 2-a and 2-b are reused with permission from references 10 and 16, respectively.

