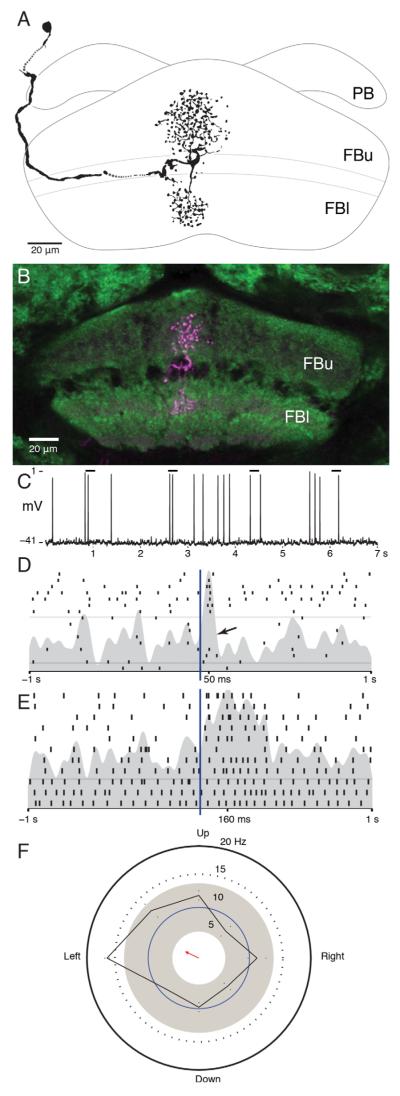
Figure 5.
Pontine neurons. A: Camera lucida reconstruction of a pontine neuron in the fan-shaped body that connects two layers within one module. B: Confocal stack showing the location of this neuron in the fan-shaped body. C: Example of spiking response to light flash stimuli. Bars indicate lights on. D: Raster plot showing an excitatory response to lights on and trials from the middle of the recording during which this stimulus failed to produce a change in firing rate (arrow). E: Raster plot showing a tonic response to a change in illumination. In this neuron, the increase in firing rate lasted for the duration of lights on. F: Direction preference plot for a white bar on a black background. Motion to the left produces an increase in firing rate greater than 2 standard deviations above the background rate, and the shape of this distribution is significantly different from random (Rayleigh test, n = 202, r = 0.156, P < 0.05). Scale bars = 20 μm. [Color figure can be viewed in the online issue, which is available at wileyonlinelibrary.com.]

