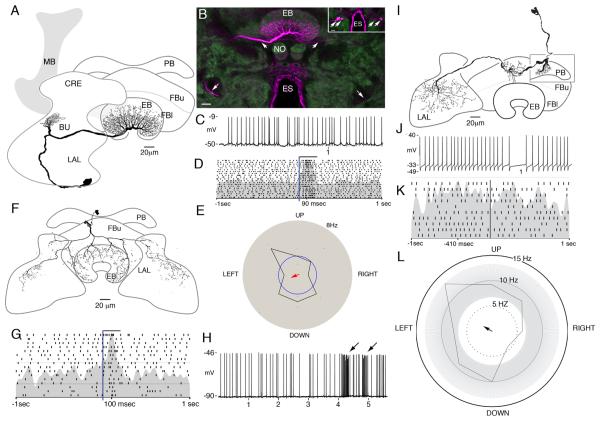
Figure 6.
Ring neurons of the ellipsoid body. A: Camera lucida reconstruction of a ring neuron with extensive branches in the ellipsoid body, a small tuft in the crepine neuropil (CRE) lying above the lateral accessory lobe (LAL), and a cell body at the lower margin of the LAL, posterior to the antennal lobes (not shown in this plane of section). B: Confocal stack showing strongly labeled arbors in the posterior ring of the ellipsoid body and a prominent neurite (arrow, middle upper left). Also visible is a faint contralateral neurite entering the ellipsoid body from the opposite side (arrow). This more weakly labeled neuron has the same morphology as the more strongly labeled nerve cell (lower arrows indicate their symmetrical paths to their cell body locations). The inset shows two pairs of cell bodies, one in each brain half, which have been filled with neurobiotin injected into the single neuron. C: Example voltage trace illustrating the variability in this neurons unstimulated activity. D: Raster plot showing an increase in firing rate in response to an increase in illumination (bar). E: Motion response of this cell for a black bar on a white background. The firing rate during the stimulus presentation is well within the variability of background firing rate (gray area), and the shape of this distribution is not significantly different from random (Rayleigh test, n = 67, r = 0.105, P > 0.05). F: Camera lucida reconstruction of an extrinsic ring neuron with extensive arbors in both LALs. The morphology of this cell corresponds to that of the ExR1 cells described by Hanesch et al. (1989). G: Raster plot showing response to flashed light stimuli. H: Voltage trace showing response to air current directed at head (arrows). I: Camera lucida reconstruction of a neuron connecting the protocerebral bridge, the fan-shaped body, and the contralateral LALs. J: Example voltage trace. K: Raster plot showing no response to changes in illumination. L: Directional tuning in response to a black bar presented on a white background. The cell is excited by movement to the upper left and inhibited by the bar moving in the opposite direction. This distribution is significantly different from random (Rayleigh test, n = 170, r = 0.158, P < 0.05). Scale bars 20 μm. [Color figure can be viewed in the online issue, which is available at wileyonlinelibrary.com.]

