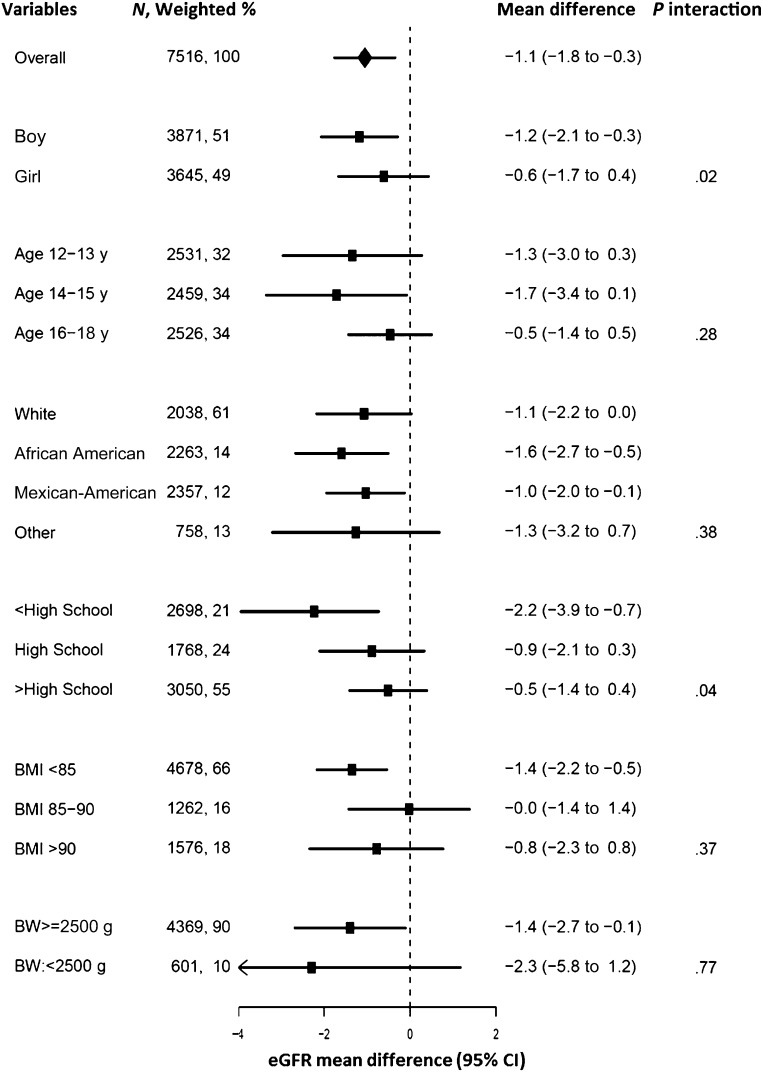
FIGURE 2.
Mean (95% CI) eGFR difference per IQR increase in serum cotinine concentrations by participant characteristics. Mean differences were adjusted for gender, age, race/ethnicity, parental educational level, BMI, and survey year. Dots represent the mean difference and horizontal lines the CIs. The P value indicates the level of significance for interaction for each participant subgroup and was estimated by using the Wald test.

