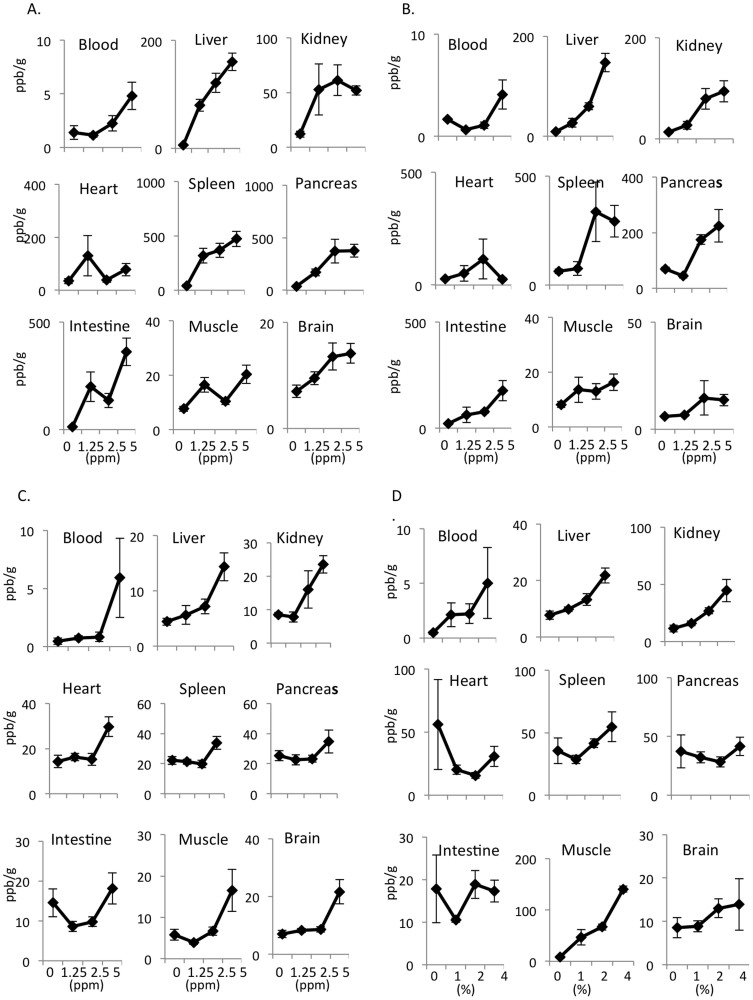
Figure 2. The concentrations of hydrogen in the blood and tissue were dependent on the dose of HSRW/HSRS and hydrogen gas administration.
Concentrations of hydrogen in the arterial blood and tissues of the liver, kidneys, heart, spleen, pancreas, intestines, muscles and brain obtained five minutes after (A) the oral administration of HSRW and (B) intraperitoneal administration of HSRS, (C) one minute after the intravenous administration of HSRS and (D) 30 minutes after the inhalation of hydrogen gas. In all experiments, the data were analyzed for more than three rats per group and expressed as the mean ± SEM. The actual number of rats is summarized in Supplemental Table 1.

