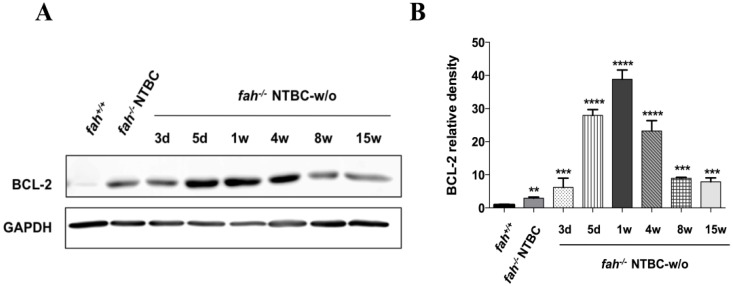
Figure 9.
BCL-2 protein expression in HT1. (A) Levels of BCL-2 in livers of fah+/+, fah−/− NTBC-treated and fah−/− NTBC-off mice; (B) Histogram shows quantitative representation of the BCL-2 protein level after normalization to levels of GAPDH. Fold-change protein level expression is reported in comparison to fah+/+ mice. Data are mean ± standard deviation for four samples. Significance of group differences was evaluated using ANOVA for multiple comparisons (** p < 0.01, *** p < 0.001, **** p < 0.0001).

