Figure 5.

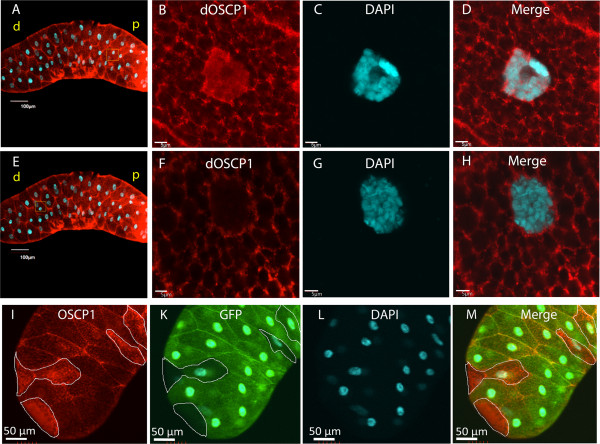
Localization of dOSCP1 in salivary gland cells. Salivary glands dissected from third instar larvae were stained with anti-dOSCP1 antibody and DAPI. (A-D) Image of proximal region. (A) Merged image of dOSCP1 signals and DAPI. (B-D) High magnification images of the proximal region. (B) dOSCP1 signals, (C) DAPI, (D) Merged image. A significant level of dOSCP1 signals was detected in the nuclei. (E-H) Image of distal region. (E) Merged image of dOSCP1 signal and DAPI. (F-H) High magnification images of the distal region. (F) dOSCP1 signals, (G) DAPI, (H) Merged image. No signals of dOSCP1 are evident in nuclei. (I-M) Image of flip-out expreriment. (I) OSCP1. (K) GFP. (L) DAPI. (M) Merged image. GFP-negative areas are enclosed. In the GFP-positive dOSCP1 RNAi clone area, levels of dOSCP1 signals are reduced. The bars indicate 100 μm (A; E) or 50 μm (B-D and I-M) or 5 μm (F-H). p, proximal; d, distal.
