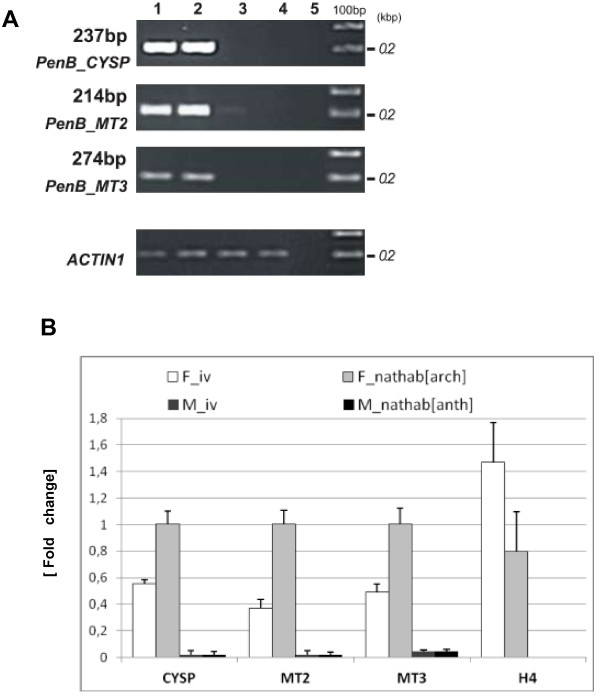
Figure 7.

Transcript levels of PenB_CYSP, PenB_MT2 and PenB_MT3 genes are regulated by growth conditions. (A) Transcripts levels of PenB_CYSP, PenB_MT2 analyzed using semi-quantitative RT-PCR. RNA was isolated in an independent experiment from: the female thalli without archegonia cultivated in vitro (lane 1), the female thalli producing archegonia collected from the natural habitat (lane 2), the male thalli without antheridia cultivated in vitro (lane 3), and the male thalli producing antheridia collected from the natural habitat (lane 4). Specific expression of three identified genes in the female thalli was analyzed by semi-quantitative RT-PCR. Negative control is shown in lane 5 and 100 bp ladder is on the right of the gels. (B) RT-qPCR analyses of three studied genes expression show different transcripts levels in the female thalli. All transcript levels were normalized against ACTIN1. All transcript levels were normalized against ACTIN1. As a control of comparable gene expression in the tested female thalli primers amplifying fragment of histone H4 were used. Calculation shows the mean ± SD from three technical replicates.
