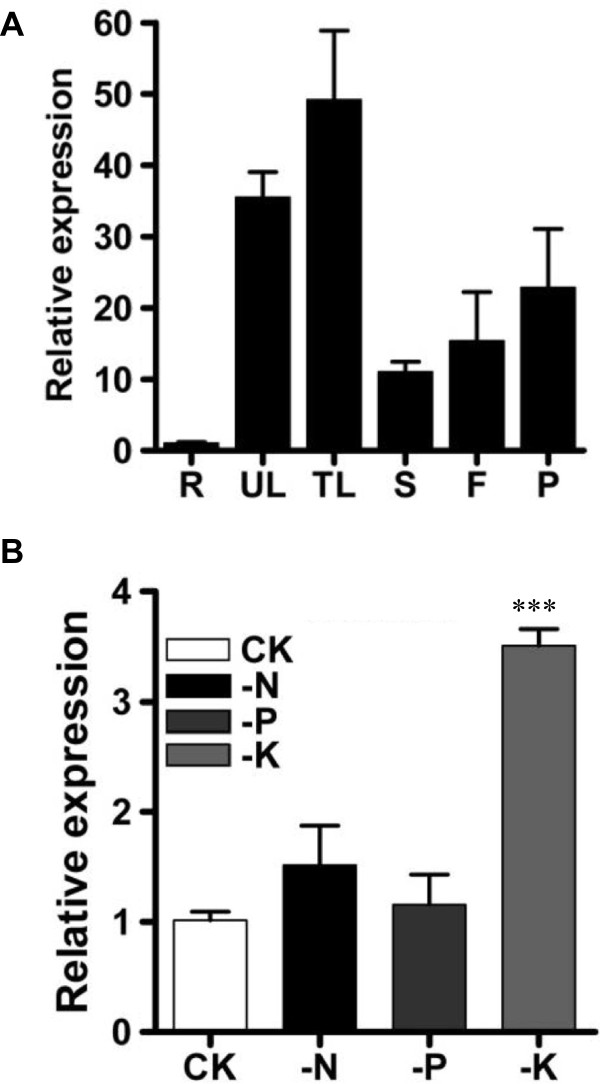
Figure 3.

GmAKT2 expression in different tissues and leaves of Williams 82 under various nutrient supply conditions. (A) Relative GmAKT2 expression in roots (R), unifoliate leaves (UL), trifoliate leaves (TL), stems (S), flowers (F), and pods (P). Soybean seedlings were grown hydroponically in growth chambers for 6 weeks. (B) Relative GmAKT2 expression in leaves of plants grown under different nutrient stress. Ten-day-old soybean seedlings were transferred into modified half-strength Hoagland hydroponic solution (CK) or solutions lacking nitrogen (-N), phosphate (-P), or potassium (-K) for 7 days. Transcript levels were calculated using the formula 2-ΔΔCt for the expression levels relative to GmACTIN. Data represent means of three biological replicates with error bars indicating SD. Asterisks indicate a significant difference between the control and treated samples (***P < 0.001).
