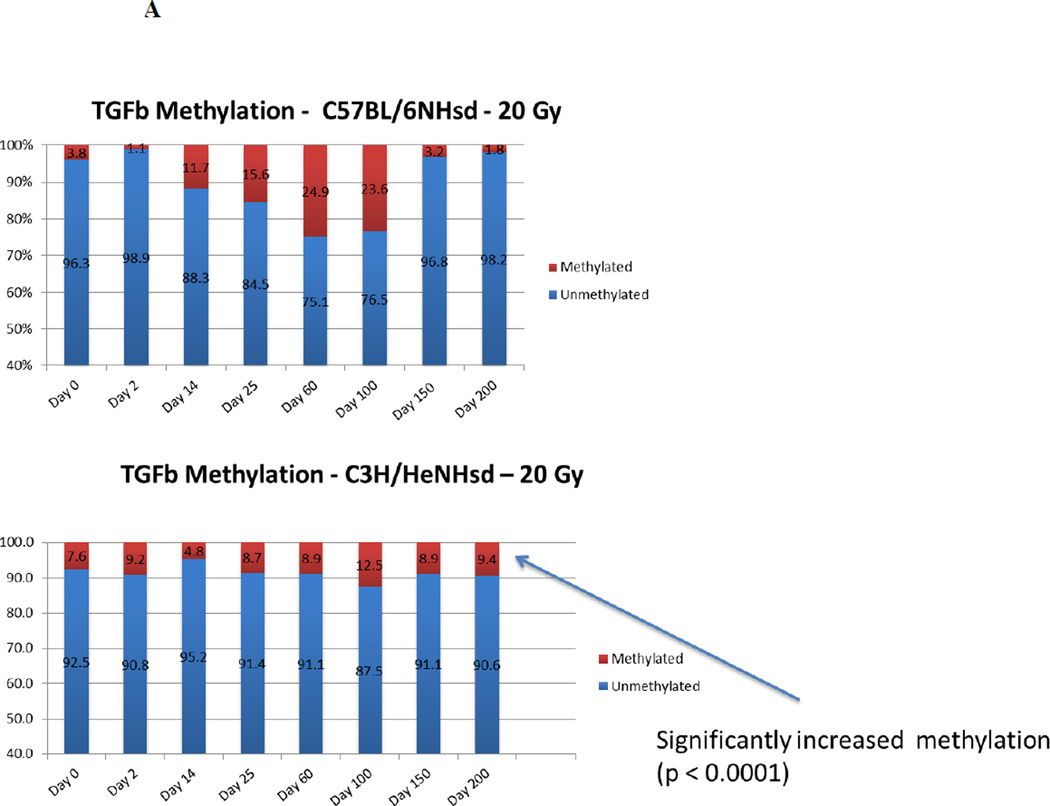
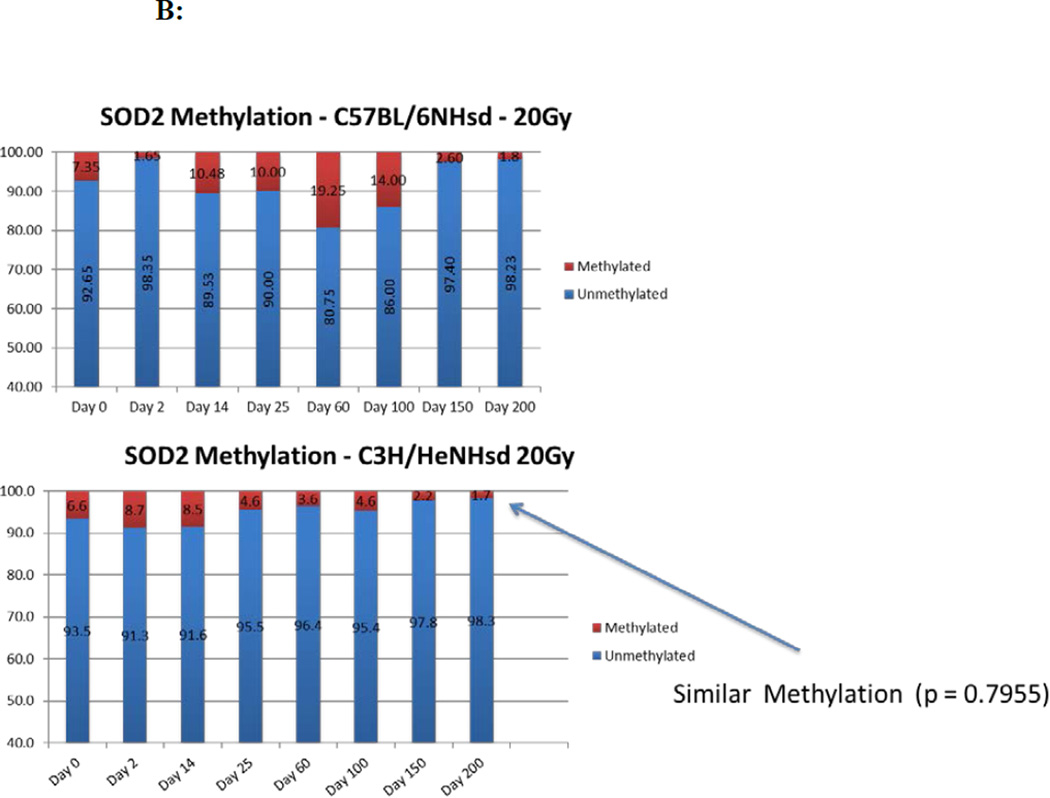
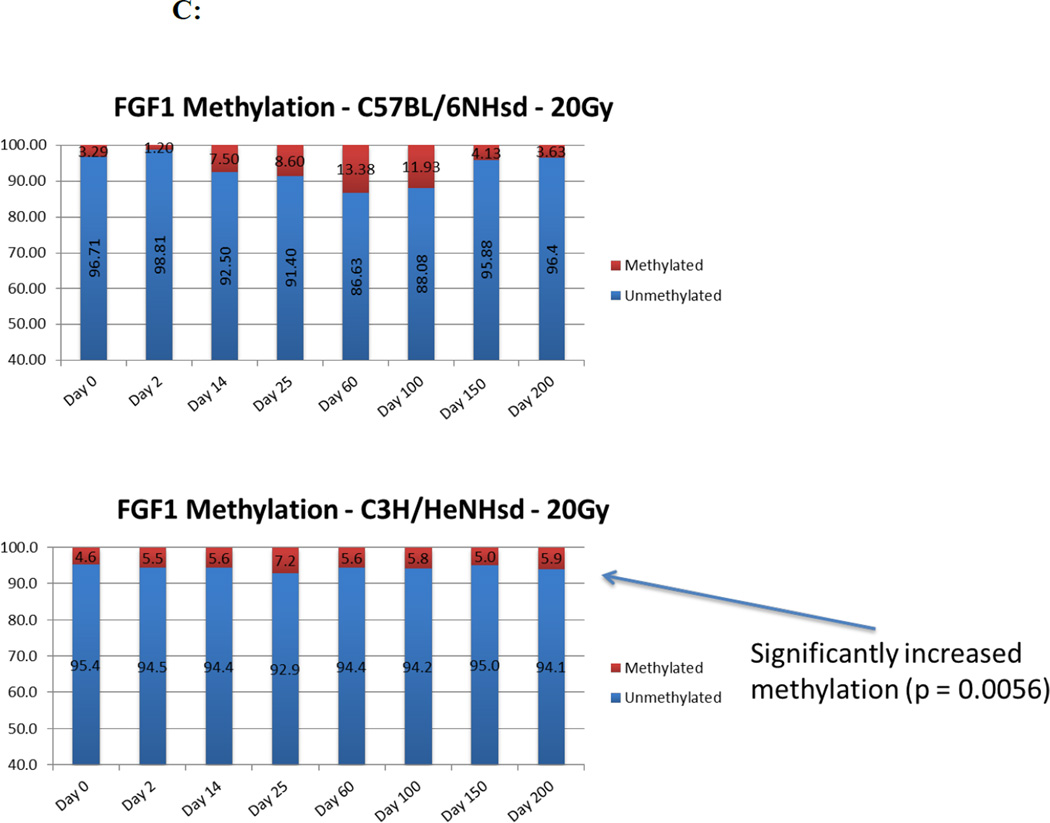
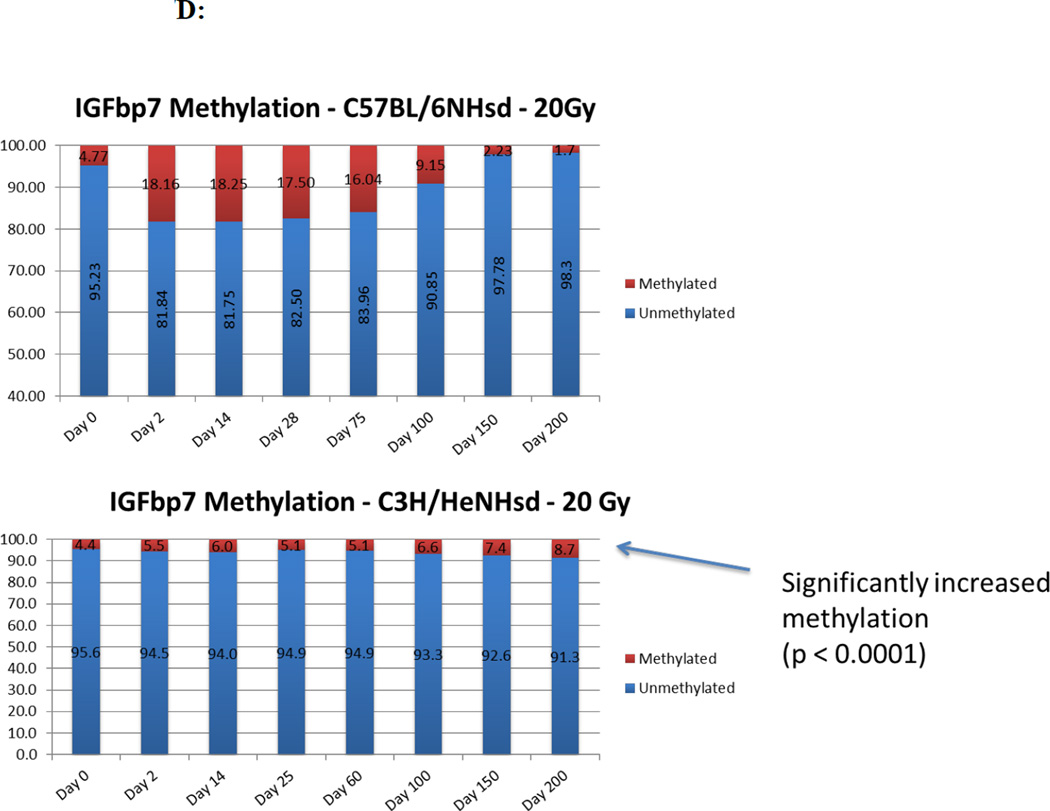
Figure 7. Different patterns in percentage CpG promoter methylation for specific genes in the lungs of 20 Gy thoracic irradiated C3H/HeNHsd compared to C57BL/6NHsd mice.
Lung tissue was removed from C57BL/6NHsd and C3H/HeNHsd female mice, DNA was extracted, and CpG promoter methylation status of genes related to fibrosis was evaluated for A) TGF-β, B) MnSOD (SOD2), C) FGF1, and D) IGFbp7). Each bar represents 100% of the promoter; the red portion represents percent methylation, and the blue portion represents percent unmethylated. There was concordance of increased methylation at respective time points where the corresponding gene transcript level was decreased. The pattern of data is shown in Table 2.


