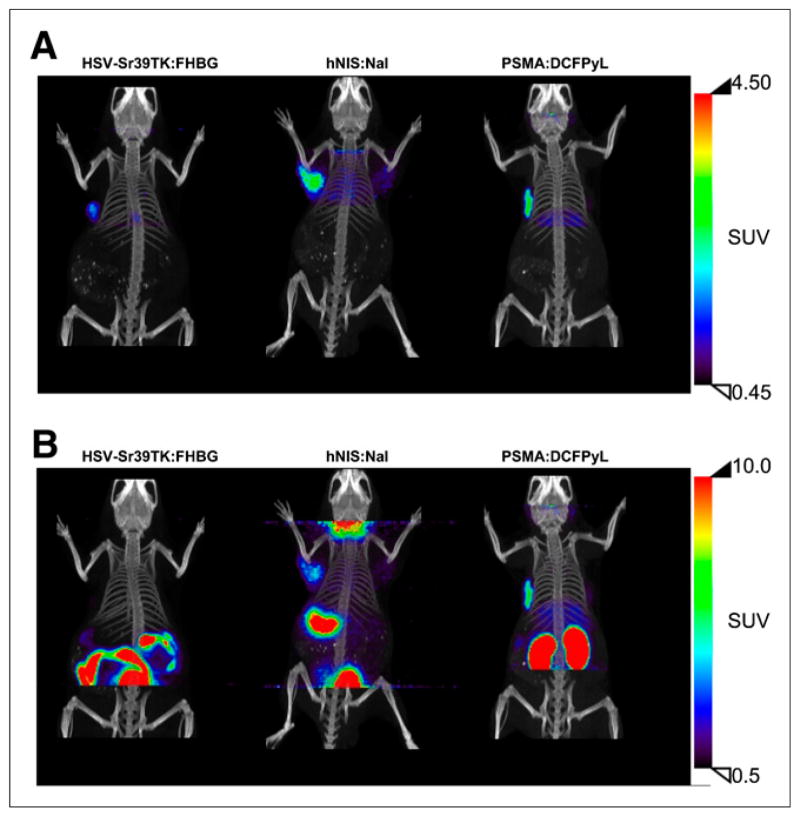
FIGURE 3.
PET/CT imaging of reporter-probe systems. Representative maximum-intensity projections of reporter-probe systems of data collected from 60 to 90 min after radiotracer injection. (A) Images cropped above liver and below thyroid display the ability of each reporter to sequester its respective probe. (B) Uncropped images demonstrate background associated with each reporter-probe system. All images were decay-corrected and scaled to the same maximum value.

