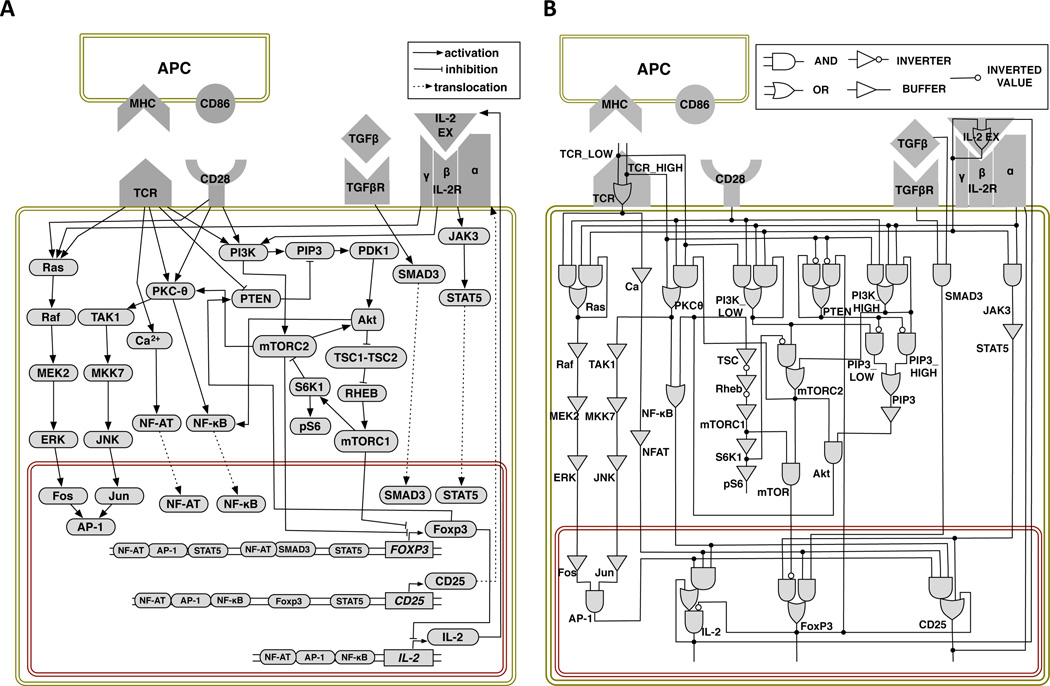
Figure 1.
Computational model of T cell differentiation: (A) Signaling network connections. Pointed arrowheads represent activation, blunt arrowheads represent inhibition, and dashed edges represent translocation. (B) Corresponding logic circuit model. Elements are represented by single logic gates (e.g., Raf) or combinations of multiple gates (e.g., Ras). Element values are computed at each time step based on the values of their inputs with instantaneous updating of gates within elements.

