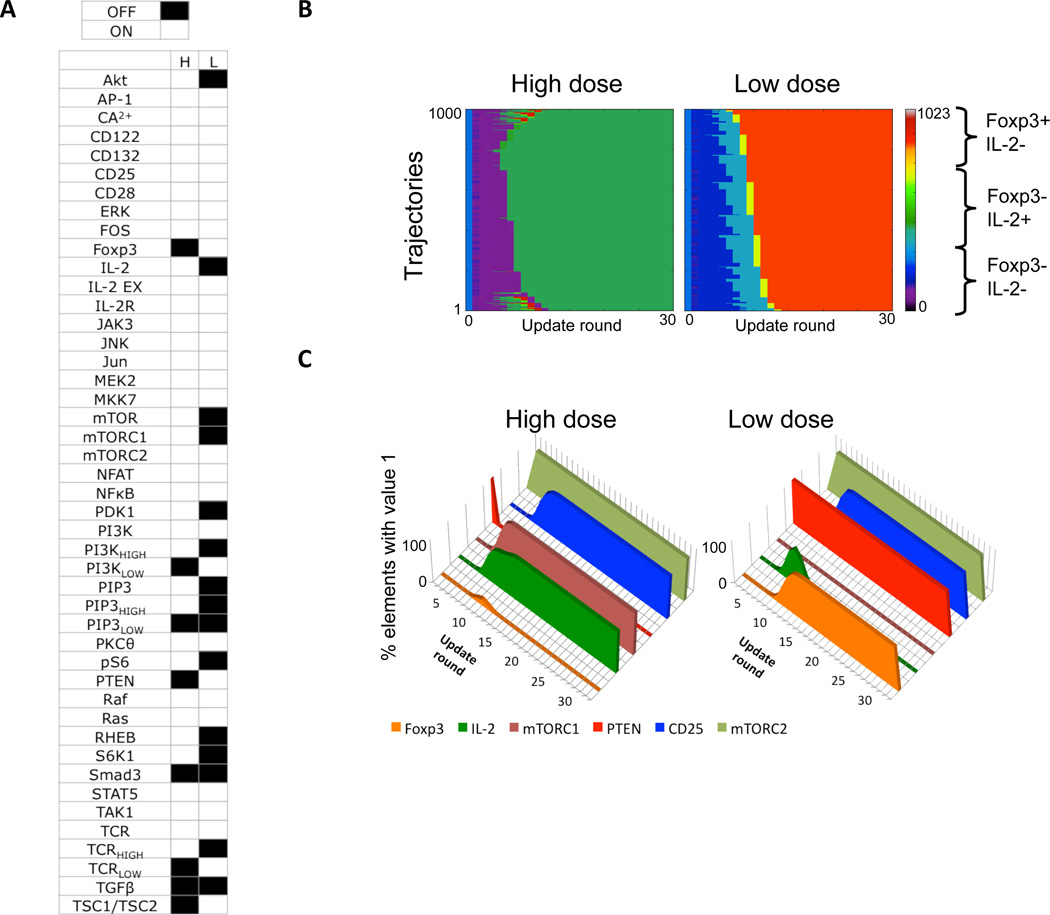
Figure 3.
Results for high and low Ag dose scenarios. (A) Values of individual elements in the steady state attractors that are reached following high (H) and low (L) Ag dose (black=OFF, white=ON). (B) Heat map representation of 1000 simulation trajectories for each scenario. (C) Average values of six key elements along the trajectories in (B).

