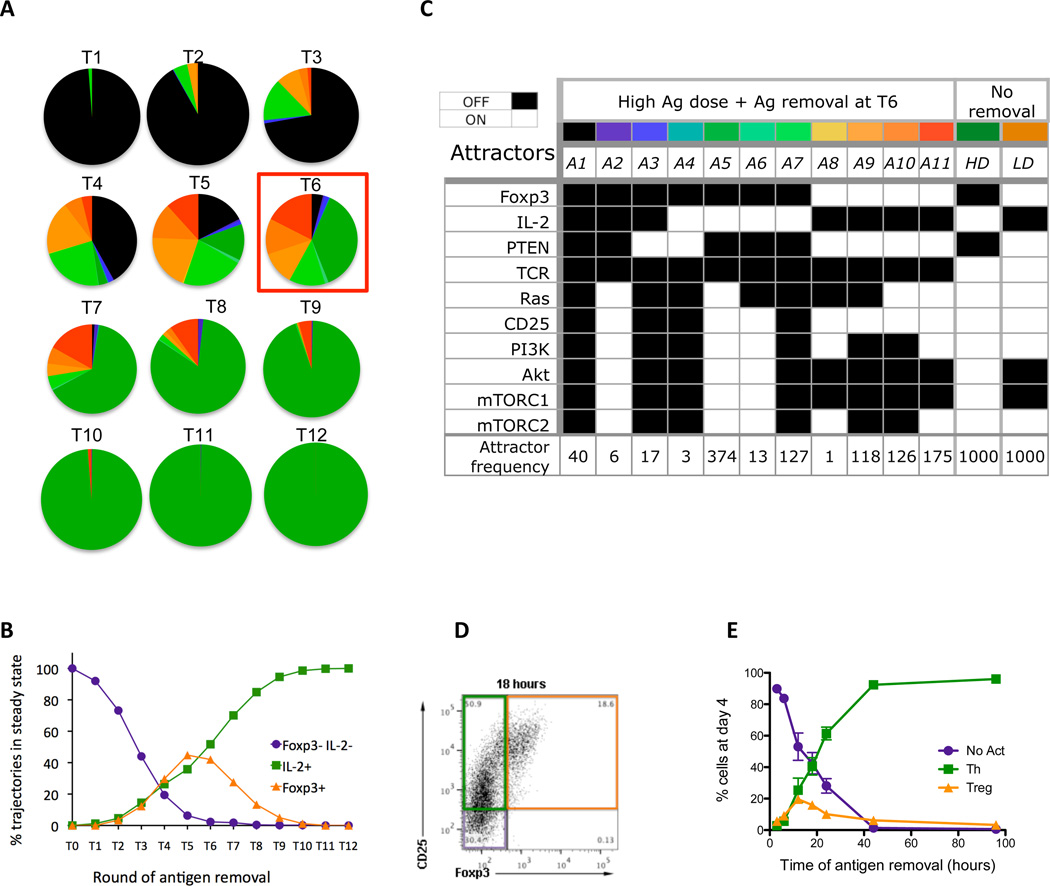
Figure 5.
Analysis of transient stimulation with high antigen dose. (A) Distribution of attractors when antigen is removed at different times, starting with removal at simulation round 1 (Tl), and incrementing the time of removal by one round, up to round 12 (T12). (B) Changes in sizes of lumped attractors (Foxp3- IL-2- population, IL-2+ population and Foxp3+ population (C) 11 attractors that are observed in simulations of antigen removal scenario T6 (colors correspond to those in part (A)), presented in terms of steady state values of ten elements (Foxp3, IL-2, PTEN, TCR, Ras, CD25, PI3K, Akt, mTORCl, mTORC2) and the number of simulation trajectories ending in each given attractor for 1000 simulation runs. (D) Flow cytometry plot identifying the three major populations induced. Purified CD4+ T cells were stimulated on plates coated with anti-CD3 (lug/ml) in the presence of soluble anti-CD28 mAb. After 18 hours of culture the cells were removed from the coated plates and placed in new wells and cultured for a total of 96 hours. Cells were analyzed by flow cytometry and results show the CD25 and Foxp3 staining on gated CD3+ CD4+ cells. CD25- Foxp3- cells (purple box) are non-activated T cells, CD25+ Foxp3- cells (green box) are Th cells and CD25+ Foxp3+ (orange box) are Treg cells. (E) Purified CD4+ T cells were stimulated as before and the cells were removed from the stimulation at the indicated times (3, 6, 12, 18, 24, 44 and 96 hours). All cells were cultured for a total of 96 hours and then were analyzed by flow cytometry to identify non-activated (No Act, purple circles) Th (Th, green squares) and Treg (Treg, orange triangles) cells, as defined in Panel D. The results are the mean ± SEM of 4–8 replicates from 3 independent experiments.

