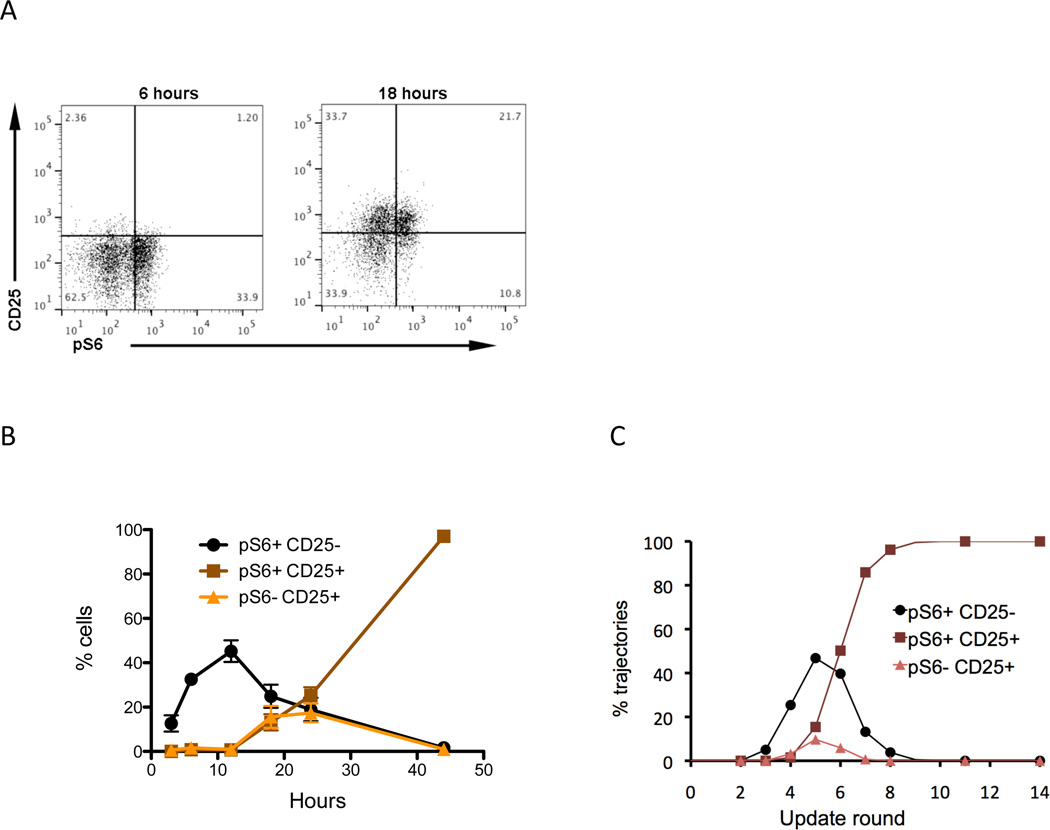
Figure 7.
State of cells at the time of removal. (A) Flow cytometry demonstrating the activation state of T cells stimulated for 6 and 18 hours. Purified CD4+ T cells were stimulated on plates coated with anti-CD3 (1ug/ml) in the presence of soluble anti-CD28 mAb. After 6 or 18 hours of culture the cells were analyzed by flow cytomtery for the presence of pS6 and CD25 on gated CD3+ CD4+ cells. (B) Time course of activation state of T cells activated with a high dose (1–2 µg/ml) anti-CD3 and anti-CD28. Cells were analyzed at the indicated times for the presence of pS6 (a measure of mTORC1 activation) and CD25. Three populations are followed pS6+ CD25- (green circle), pS6+ CD25+ (red square) and pS6- CD25+ (blue triangle) over time. The results are the mean ± SEM of 4–8 replicates from 3 independent experiments. (C) Distribution of pS6+ CD25-, pS6+ CD25+, and pS6- CD25 negative trajectories for high Ag dose stimulation, at different rounds before antigen is removed.

