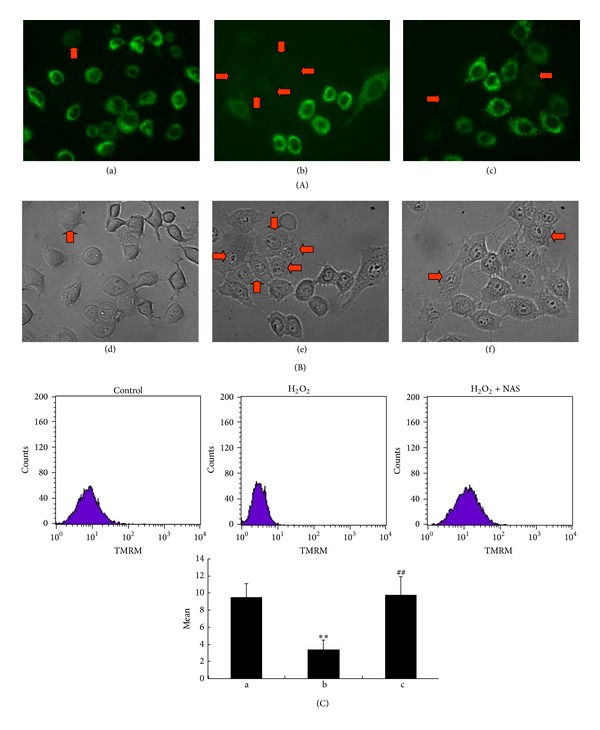
Figure 4.

NAS inhibits the dissipation of ΔΨm of HepG2 cells induced by H2O2. (A) (a, b, c): ΔΨm observed with rhodamine 123 staining under fluorescence microscopy. (B) (d, e, f) Morphologic changes in nuclei observed under the inverted phase contrast microscope. (a, d) Untreated group; (b, e) H2O2 group, HepG2 cells incubated with 200 μM H2O2 for 6 hours; (c, f) H2O2 + NAS group, 10 μM NAS was administered before subjecting to H2O2. (C) ΔΨm detected by flow cytometry after TMRM staining. Note that untreated group cells display a granular pattern of TMRM fluorescence in cytoplasm; H2O2-treated cells showed diffuse pattern of TMRM fluorescence, indicating apoptotic nuclei; the dissipation of ΔΨm was almost completely abrogated by pretreatment with NAS. The arrows indicate the apoptotic cell. Original magnification ×400.
