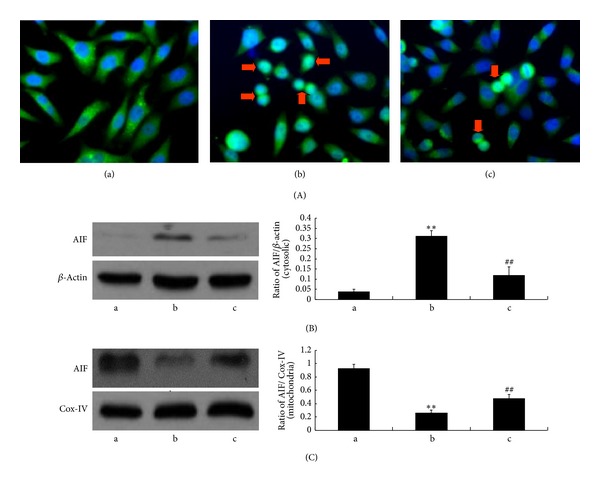
Figure 6.

NAS inhibits the release of AIF from mitochondria in response to H2O2. (a) Untreated group; (b): H2O2 group, HepG2 cells incubated with 200 μM H2O2 for 6 hours; (c) H2O2 + NAS group, 10 μM NAS was administered before subjecting to H2O2. (A) The expression of AIF as assessed by immunocytochemistry ((a)–(c): 400x). (B, C): Cytosolic and mitochondrial fractions were prepared, and the expression of AIF was determined by western blot analysis. (B) Cytosolic fractions; (C) mitochondrial fractions. Note the AIF nuclear translocation and significantly increased AIF in cytosolic fractions and decreased AIF in mitochondrial fractions in the H2O2 group compared with untreated group (P < 0.01). NAS attenuated the changes in AIF. The results are expressed as ratio of AIF optical density values to those of β-actin or COX-IV, and each value represents the mean ± SD of three independent experiments. The annotation *indicates a P value < 0.05 versus untreated group. The annotation ##indicates a P value < 0.01 versus H2O2 group.
