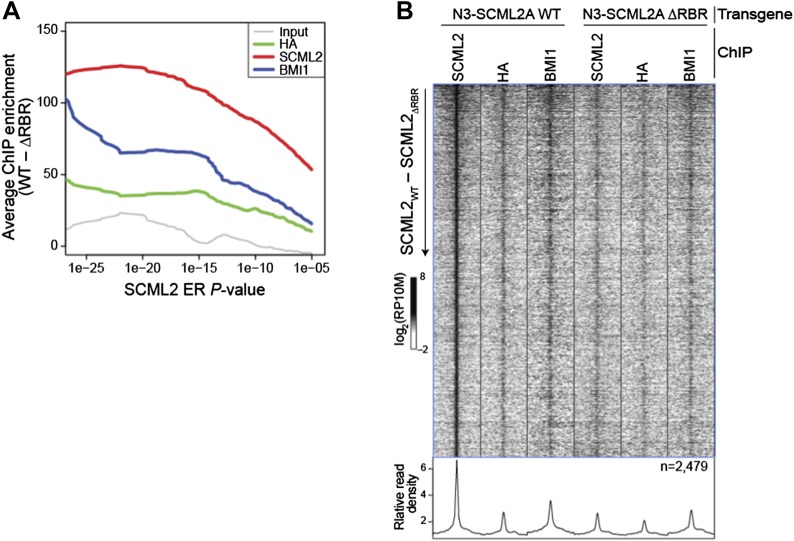
Author response image 3. Comparison of WT and ΔRBR ChIP-seq on unfiltered SCML2 ERs.
(A) Enrichment is defined as the normalized number of reads for the indicated sample in 1 kb regions centered on the ER summit in 293T-REx expressing N3–SCML2 WT minus the reads in the same regions in cells expressing N3–SCML2 ΔRBR. The average enrichment for each set of ERs, as defined by their P-value is shown on the y axis, starting from the full SCML2 ER set on the right (N = 2,479, P < 10-5), to only ERs with P < 10-26 on the left of the graph (N = 24). (B) Same heatmap as shown in Figure 5E, but this time including all 2,479 SCML2 ERs.

