. 2014 Jul 1;3:e02637. doi: 10.7554/eLife.02637

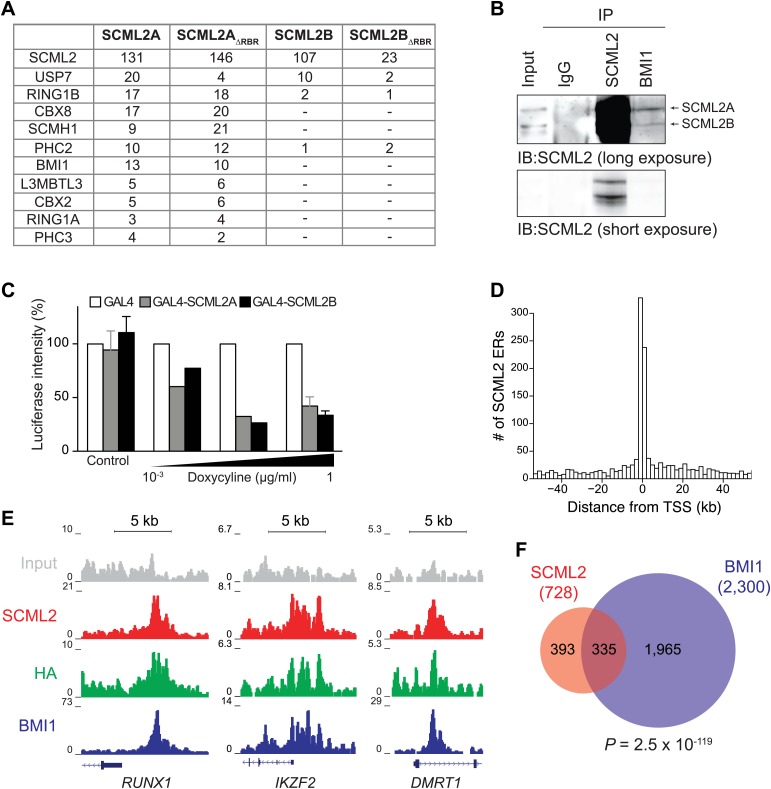
Figure 4. SCML2 interacts and shares target genes with BMI1.

(A) Proteins detected by mass spectrometry after affinity purification of SCML2A, SCML2AΔRBR, SCML2B and SCML2BΔRBR from the chromatin fraction of 293T-REx cells. The number of peptides identified for each protein is indicated. (B) IP of SCML2 and BMI1 from the chromatin fraction of HeLa cells. Two exposures are shown. (C) 293T-REx cells containing an integrated luciferase reporter preceded by UAS repeats were induced to express the indicated transgenes with increasing amounts of doxycycline. 24 hr after induction the activity of the luciferase reporter was assayed. Bars represent the luciferase activity normalized to the non-induced GAL4-only control. (D) Distribution of SCML2 ERs around TSSs of protein coding genes. (E) Normalized ChIP-seq read densities for SCML2 (red), HA (green), and BMI1 (blue) as compared to input (gray) at three representative loci. (F) Overlap of gene targets for SCML2 and BMI1, as defined by having an ER for the respective protein within 10 kb of the TSS. p-value was calculated according to the hypergeometric distribution.

DOI: http://dx.doi.org/10.7554/eLife.02637.009

Figure 4.

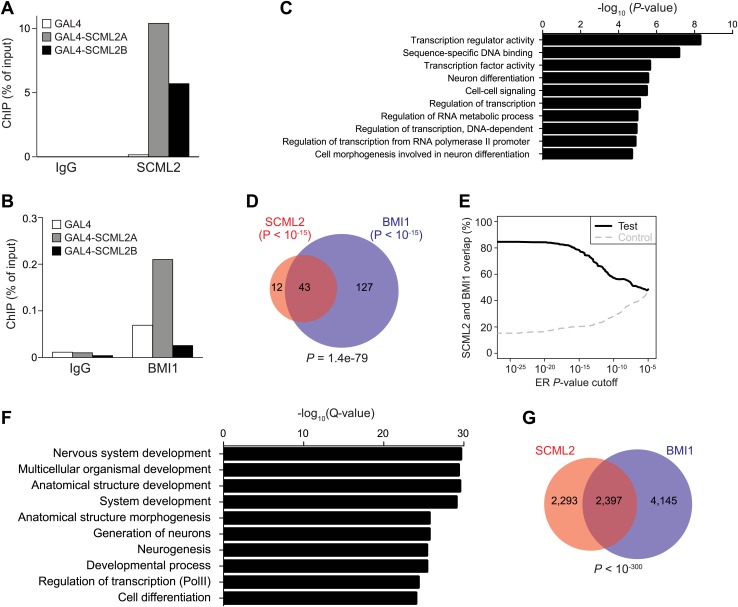
Figure 4—figure supplement 1. Artificial recruitment of SCML2 and ChIP-seq analysis.

Figure 4—figure supplement 1.

(A and B) ChIP-qPCR quantification of SCML2 (A) and BMI1 (B) association with a reporter locus in 293T-REx cells after artificial tethering of SCML2A or SCML2B. ChIP from cells with the tethering tag alone (GAL4) is shown as control. (C) Top 10 most enriched GO terms in the 728 genes with SCML2 ERs within 10 kb from the TSS in 293T-REx cells. (D) Overlap of gene targets for SCML2 and BMI1 as in Figure 4F but only considering ERs with p-value <10−15. (E) Overlap of gene targets for SCML2 and BMI1 (y axis) as a function of the ER p-value (x axis). The control line was obtained by shuffling the p-values assigned to the ERs. (F) Top 10 most enriched GO terms in genes with SCML2 ERs within 10 kb from the TSS in K562 cells. (G) Overlap of gene targets for SCML2 and BMI1 in K562 cells, as defined by having an ER for the respective protein within 10 kb of the TSS. p-value was calculated according to the hypergeometric distribution.