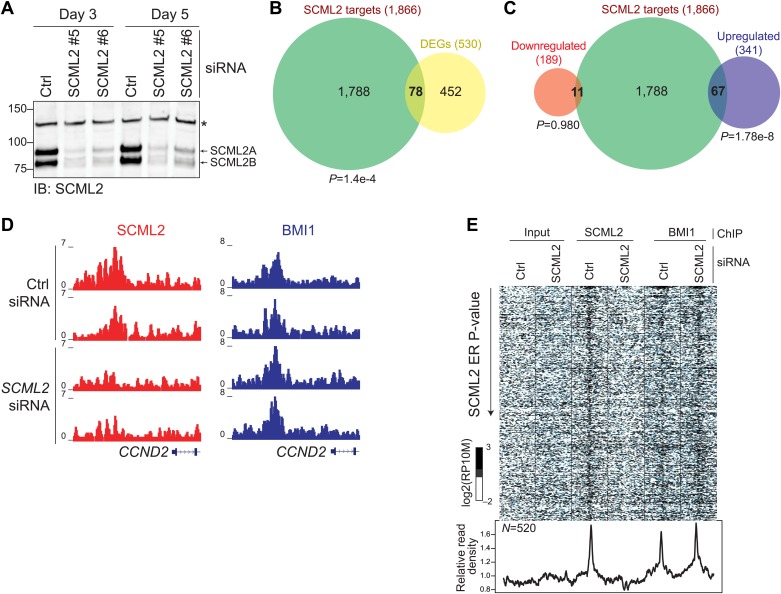
Figure 7. Functional consequences of SCML2 depletion.
(A) Western blot for SCML2 in 293T-REx treated for 3 or 5 days with control siRNAs (Ctrl) or two different siRNAs against SCML2 (#5 and #6). The band marked with an asterisk corresponds to a cross-reacting protein and serves as loading control. (B) Overlap of all DEGs with p<0.2 and genes closest to an SCML2 ER. (C) Same as (B) but DEGs were divided in downregulated and upregulated. (D) Normalized ChIP-seq read densities for SCML2 (red) and BMI1 (blue) in two biological replicates after treating 293T-REx with control (Ctrl) or SCML2 siRNAs. (E) Heatmap for all SCML2 ERs showing decreased occupancy (log2 (SCML2ctrl/SCML2KD) > 0.5) after SCML2 KD (n = 520). Profiles for input chromatin, SCML2 and BMI1 ChIP-seq are shown. Read densities were normalized and log-converted. Windows span 2.5 kb on each side of the ER summit and were divided into 25 bp bins.


