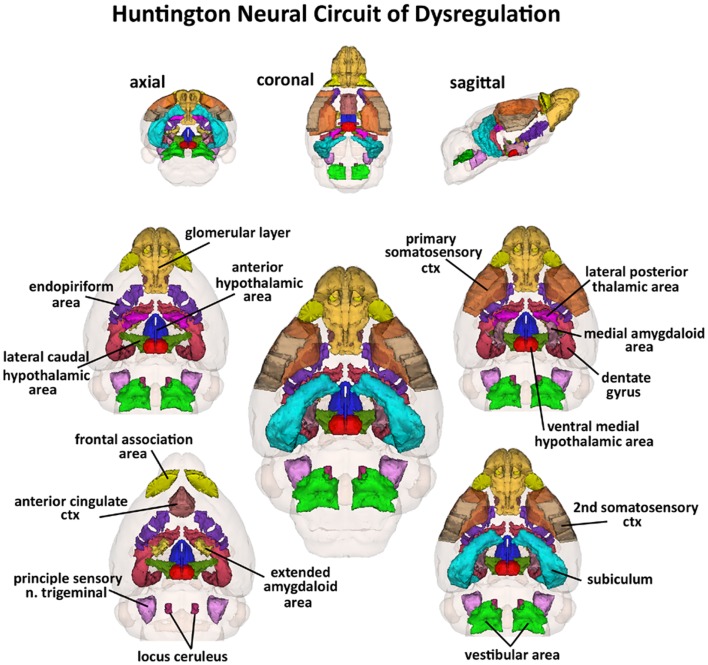
Figure 3.
Huntington neural circuit of dysregulation in response to almond odor. The 17, color-coded and labeled 3D volumes shown above were identified from 116 brain areas in the mouse atlas as having a significantly different BOLD signal between genotypes in response to the odor of almond. These areas are listed in Table 1. The central image is a coronal view of a translucent shell of the brain showing the total composite and location of the different 3D volumes of interest. Surrounding this are different layers of the neural circuit showing a caudal (deepest) to dorsal perspective of the different brain volumes. The panels on the top show the neural circuit in different orthogonal directions.

