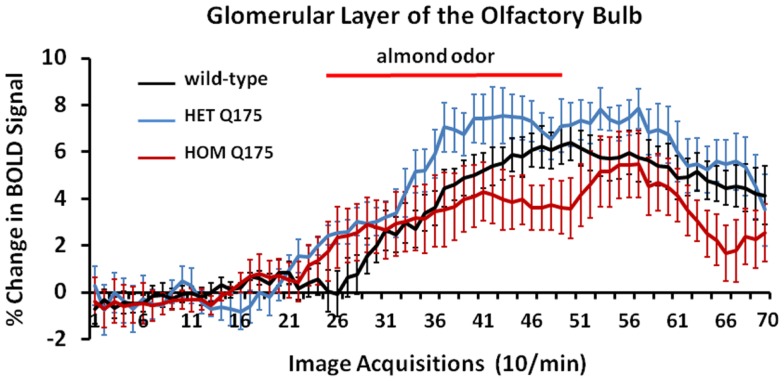
Figure 7.
Blood oxygen level dependent signal change over time in response to almond odor. Shown are the changes in the BOLD signal in the glomerulus of the olfactory bulb for each genotype in response to the presentation of almond odor following a 2 min baseline of 20 image acquisitions. While the time series are similar in that each genotype shows a comparable baseline and onset of activation there is a significant difference between the time series and an interaction between the time series and genotypes as shown in the two-way repeated measures ANOVA. Each time point is the mean BOLD signal ± SEM.

