Figure 6.
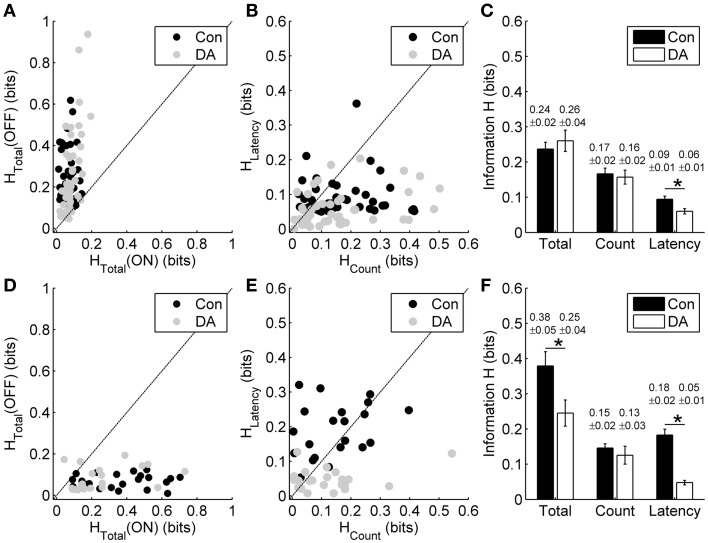
Effects of DA on spike count coding and response latency coding. (A) Scatter plot of the total information carried by the entire ON- and OFF-sequence in the control (Con) and DA conditions during exposure to different light ON durations for each neuron. (B) Scatter plot of the information carried by the spike count and the response latency of OFF response in the control and DA conditions during exposure to different light ON durations for each neuron. (C) Statistical results of the total information carried by the entire OFF-sequence, the information carried by the spike count and the response latency of OFF response in the control and DA conditions during exposure to different light ON durations. n = 45 neurons from 6 retinas. (D) Scatter plot of the total information carried by the entire ON- and OFF-sequence in the control and DA conditions during exposure to different light OFF intervals for each neuron. (E) Scatter plot of the information carried by the spike count and the response latency of ON response in the control and DA conditions during exposure to different light OFF intervals for each neuron. (F) Statistical results of the total information carried by entire ON-sequence, the information carried by the spike count and the response latency of ON response in the control and DA conditions during exposure to different light OFF intervals. n = 23 neurons from 3 retinas. Error bars indicate ± s.e.m., *p < 0.05, paired t-test.

