
Figure 2.
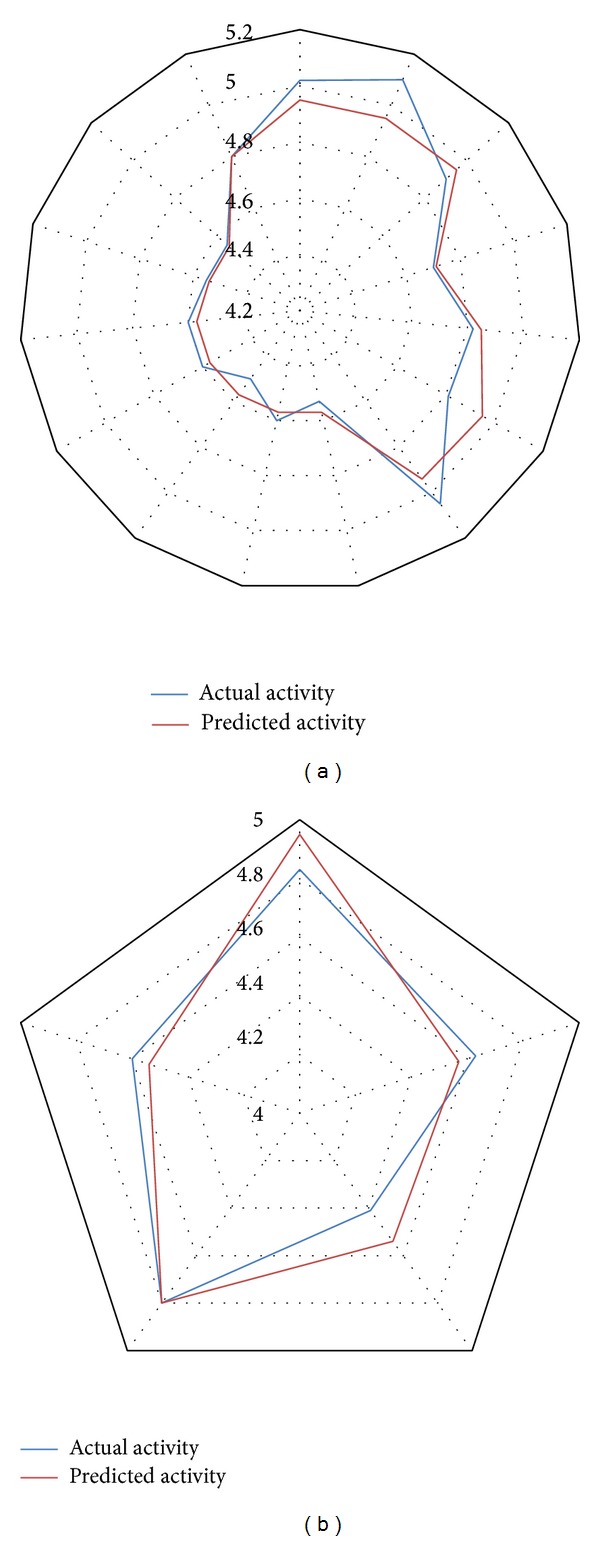
(a) Radar plot showing fitness of predicted and actual activity values of training set. (b) Radar plot exploring fitness of predicted and actual activity values of test set.
Official websites use .gov
A
.gov website belongs to an official
government organization in the United States.
Secure .gov websites use HTTPS
A lock (
) or https:// means you've safely
connected to the .gov website. Share sensitive
information only on official, secure websites.
(a) Radar plot showing fitness of predicted and actual activity values of training set. (b) Radar plot exploring fitness of predicted and actual activity values of test set.