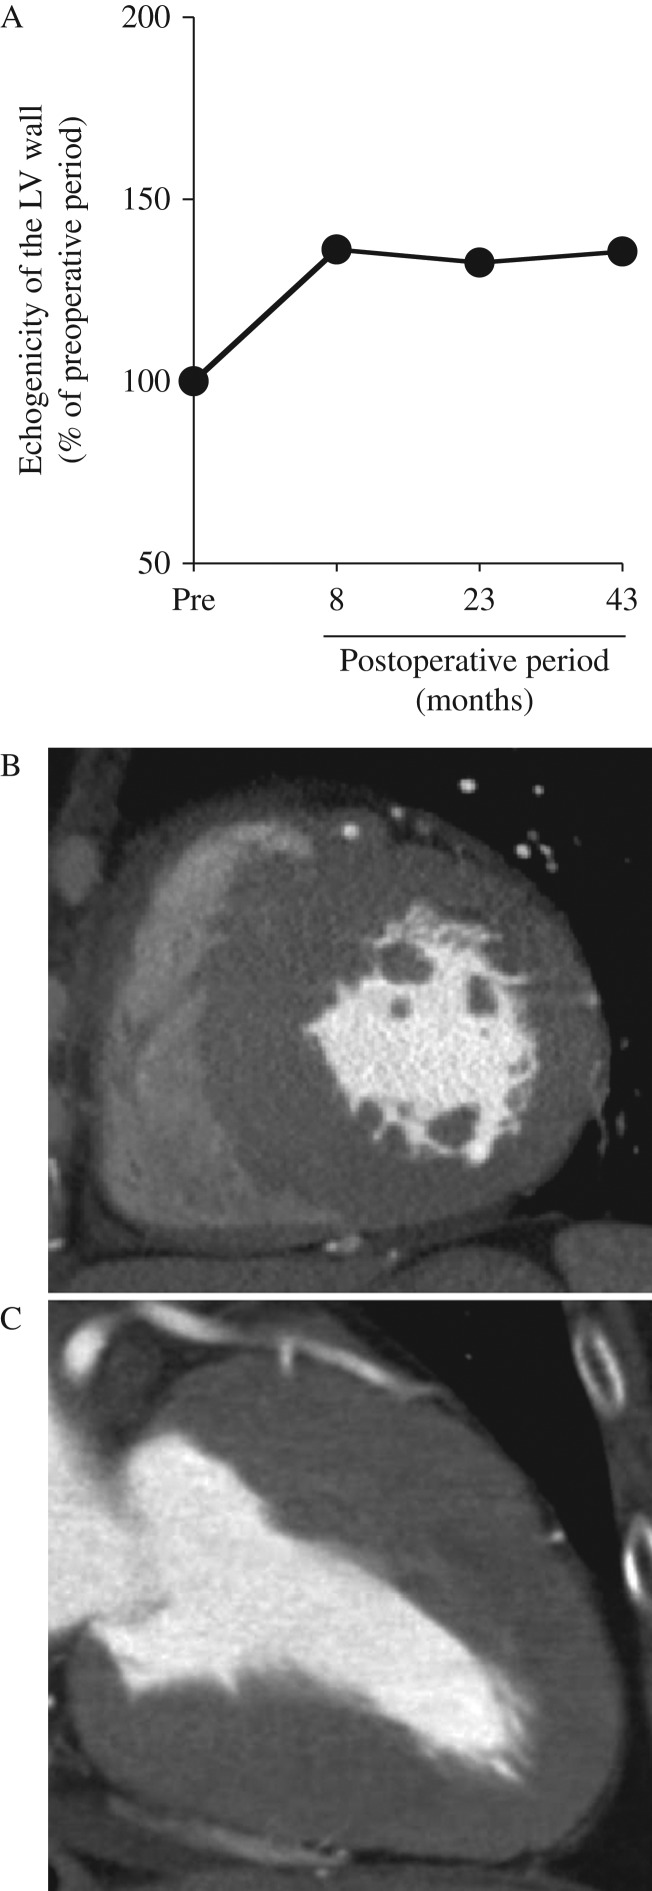
Figure 4.
Change in ultrasound reflectivity and characteristics of CT signal density of the left ventricular wall. A 9×9 mm region of interest imaged by echocardiography was positioned in the mid-myocardium of the anteroseptal and posterior walls, and a 2×2 mm region of interest was positioned in the pericardium for reference. The ultrasound reflectivity of the regions was quantified using the NIH Image Software (Image J version 1.2; National Institutes of Health, Bethesda, MD, USA). The values in the graph (closed circles) represent the relative levels of echogenicity of the anteroseptal and posterior walls to those of the pericardium (A). Short-axis (B) and axial images (C) by contrast-enhanced cardiac multidetector-row CT showed myocardial hypoenhancement in the anteroseptal wall before the treatment.

 This work is licensed under a