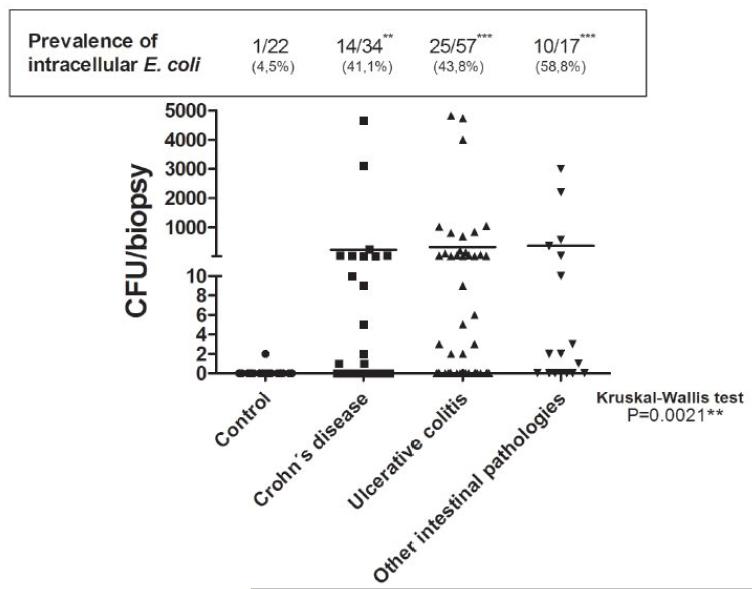
Figure 1. Intracellular E. coli in intestinal biopsies from CD, UC and OIP patientes.
Ileal biopsies from patients with CD (n=34), UC (n=57), OIP (n=17), and controls (n=22) were incubated with gentamicin for 1h, and homogenates were then plated in MacConkey agar. Graph shows the bacterial content represented as colony-forming units (CFU) of identified intracellular E. coli in each biopsy and mean bacteria in each group (Kruskal-Wallis two-tailed test, Dunn’s Multiple Comparison test was used, significance level set at <0.05). Prevalence of putative invasive E. coli is expressed as the percentage of patients with the bacteria in each group; Fisher’s exact test with a two-sided p-value was used to evaluate statistical significance as compared to the control group (p<0.05, CD p**=0.0023, UC p***=0.0005, OIP p***=0.0003).

