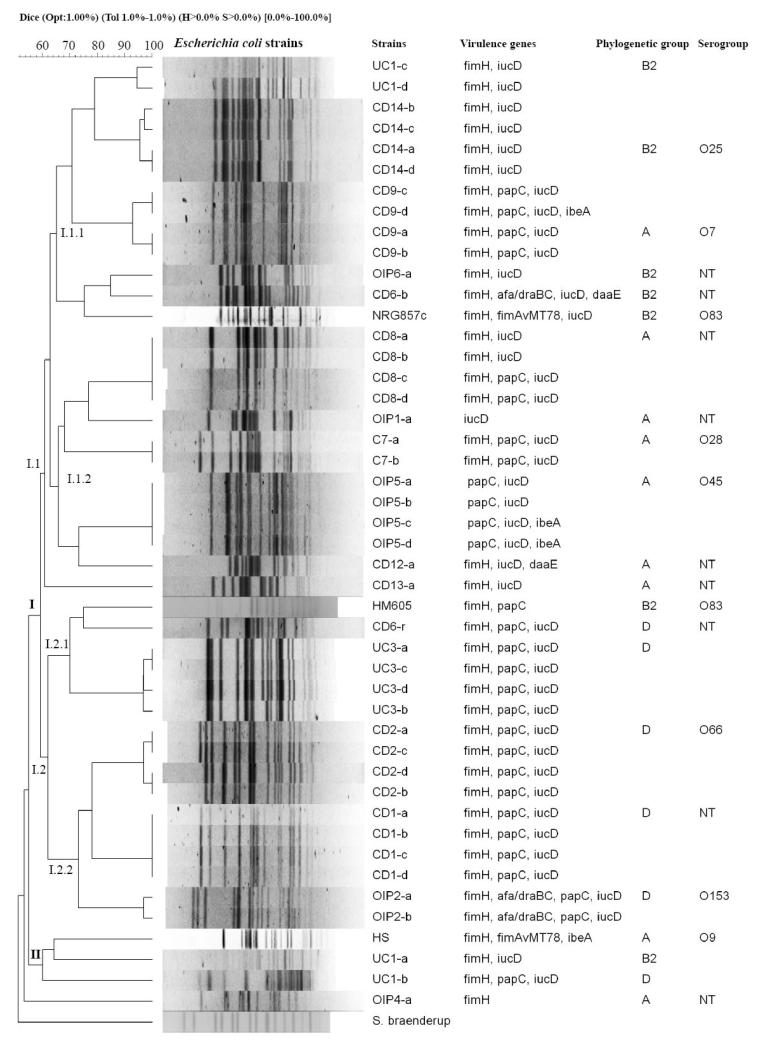
Figure 2. Genetic variability among E. coli isolates from patients with CD, UC and OIP.
Dendrogram based on pulsed-field gel electrophoresis (PFGE) of E. coli strain DNA digested with XbaI. PFGE analysis identified two groups of genetically-related strain clusters (I and II). Cluster A harboured the greatest number of strains and was in turn divided into I.1 (I.1.1 and I.1.2) and I.2 (I.2.1 and I.2.2). The right side of the figure shows the strain name (patient code-clone), virulence genes identified in each strain by PCR, phylogenetic group and serogroup. E. coli isolates were compared to HS commensal bacteria, and NRG857c and HM605 reference AIEC strains.

