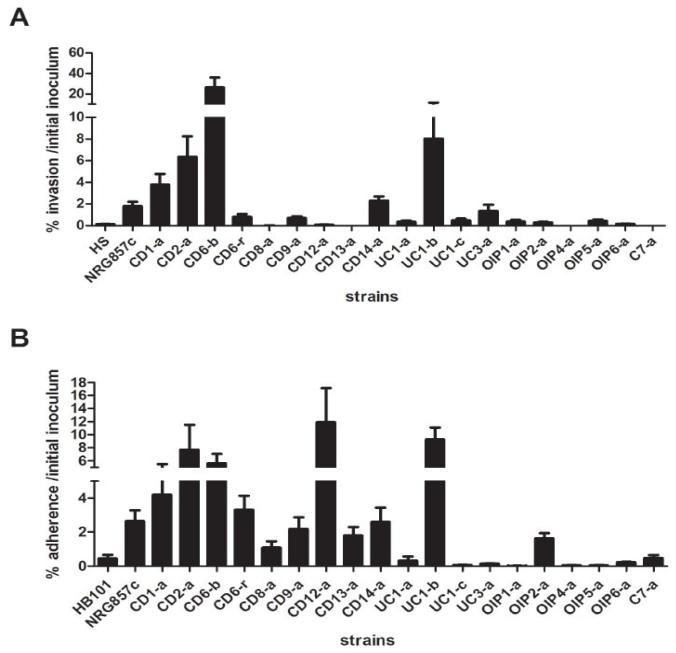
Figure 3. Invasion and adhesion of isolated E. coli strains in epithelial cells.
(A) To evaluate invasion, Caco-2 cells were infected with representative E. coli strains isolated patient-derived tissue with a MOI=10 for 3h and then incubated with gentamicin for 1h. Graph shows the percentage of inoculum surviving gentamicin treatment. Graph represents mean and standard errors of three independent experiments in duplicate. (B) The capacity of isolated E. coli to adhere to Caco-2 cells was evaluated using a MOI=10 for 30 min. Graph shows the percentage of adhered bacteria to epithelial cells related to the initial inoculum. Data represents mean and standard errors of three independent experiments in duplicate.

