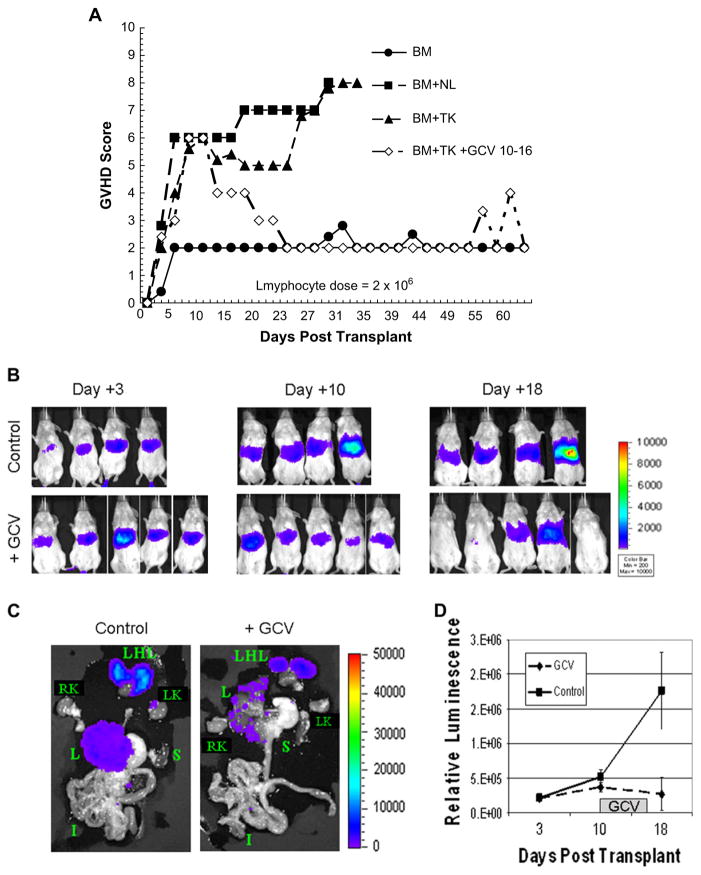
Figure 4.
Control of GVHD by GCV administration using the GVHD score and luciferase imaging. (A): Mice were scored for GVHD as described in Materials and methods. The daily score for one of the experiments described in Figure 2 is shown. A rapid decline in the GVHD score is apparent in the cohort treated with TK+TC (TK) that received GCV on days 10 through 16 by intraperitoneal injection. BM, bone marrow; NL, unmanipulated T cells. (B): Mice were transplanted as in the other experiments, but with 4 × 10⁶ HSV-TK+ T cells cotransduced with fiber-modified adenoviral vector expressing firefly luciferase. Representative control (top row) and GCV-treated days 7 to 13 (bottom row) mice were imaged as described on days 3, 10, and 18, corresponding to early GVHD pre-GCV, mid-GCV, and post-GCV treatment time points and sacrificed on day 19. (C): Imaging of the internal organs from two representative mice sacrificed on day 19. Organs are labeled as follows: I, intestines; LHL, lung–heart–lung; L, liver; LK, left kidney; RK, right kidney; S, spleen. (D): Relative luminescence of the GCV-treated mice compared with the control mice at days 3, 10, and 18 is shown. The period of GCV administration is shown by the gray rectangle. Signal intensity of the GCV-treated mice relative to the control mice was 1.97, 0.11, and 0.115 at days 3, 10, and 18 days, respectively, for the whole body images and 0.14 (liver), 0.17 (lungs), 0.26 (spleen) 0.30(kidneys) 0.55(intestines) for the organs.

