Figure 6.

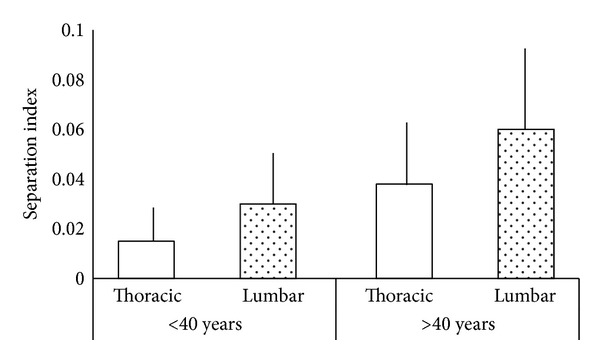
Comparison of the separation index (SI) in the ≤40 years and >40 years groups. Thoracic and lumbar segments were compared. Errors bars indicate the standard deviation.

Comparison of the separation index (SI) in the ≤40 years and >40 years groups. Thoracic and lumbar segments were compared. Errors bars indicate the standard deviation.