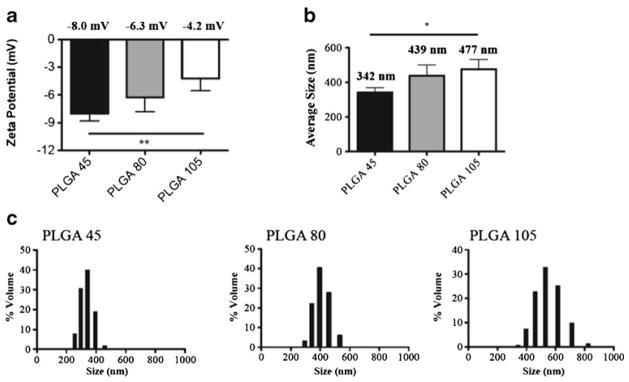
Fig. 2.

DLS and charge measurements of nanoparticles synthesized using different molecular weights of PLGA. (a) Average zeta potential values for PLGA 45, 80 and 105. (b) Average particle diameters for PLGA 45, 80 and 105 as measured by DLS. (c) Size distributions for PLGA 45, 80 and 105 as measured by DLS. Data are represented as mean +/− SD. In all experiments, statistical analysis was performed using student t-test where (*) represents p<0.05, (**) represents p<0.01.
