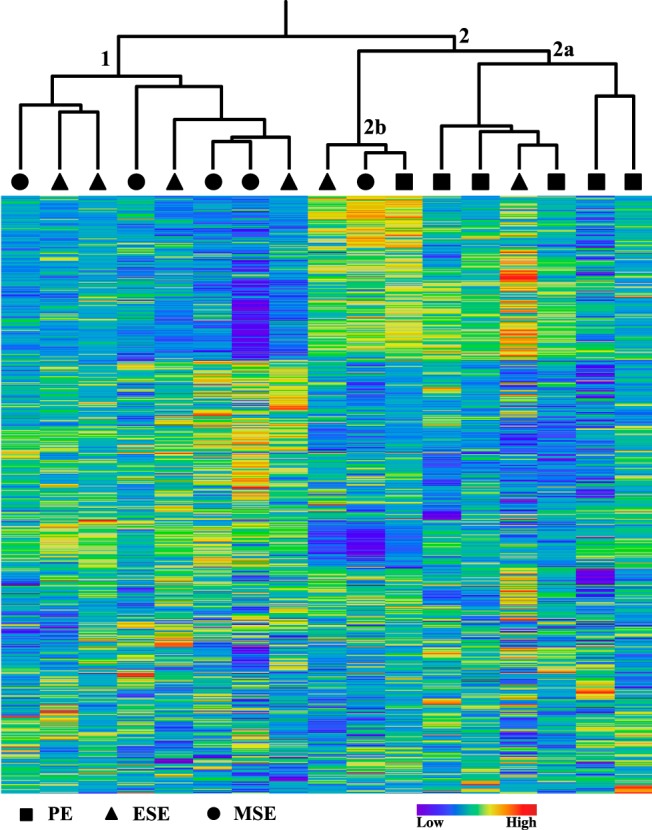
Figure 1.

Two-dimensional unsupervised hierarchical cluster analysis of 17 samples and the top 10% (2578) of probes with the most variable DNA methylation levels. Cluster 1 includes only secretory samples, whereas cluster 2 includes all PE samples and 1 ESE sample in 2a and 1 PE, 1 ESE, and 1 MSE sample in 2b. Diamonds, PE; triangles, ESE; circles, MSE. The heat map represents less methylated (dark blue) to more methylated (dark red).
