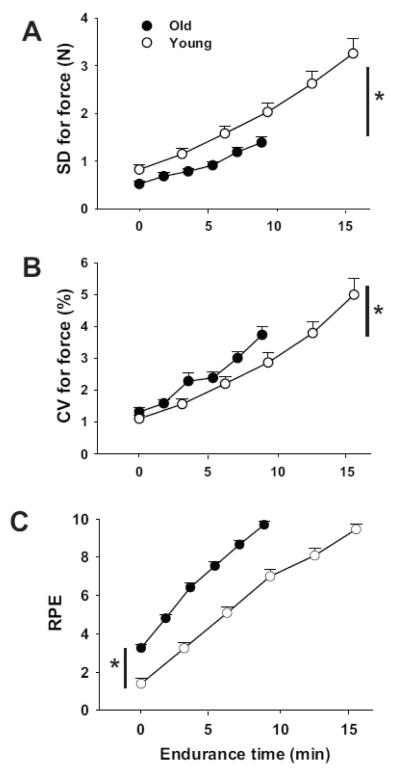
Figure 4.
Mean ± SEM for standard deviation (A) and coefficient of variation (CV, B) for the force (%) applied to the load (Fig 1) and rating of perceived exertion (RPE, C) during the dorsiflexor fatiguing contraction for young and old adults. Open symbols represent young adults, and filled symbols denote old adults. * p < 0.05 group differences between final (A and B) and initial (C) values between young and older adults.

