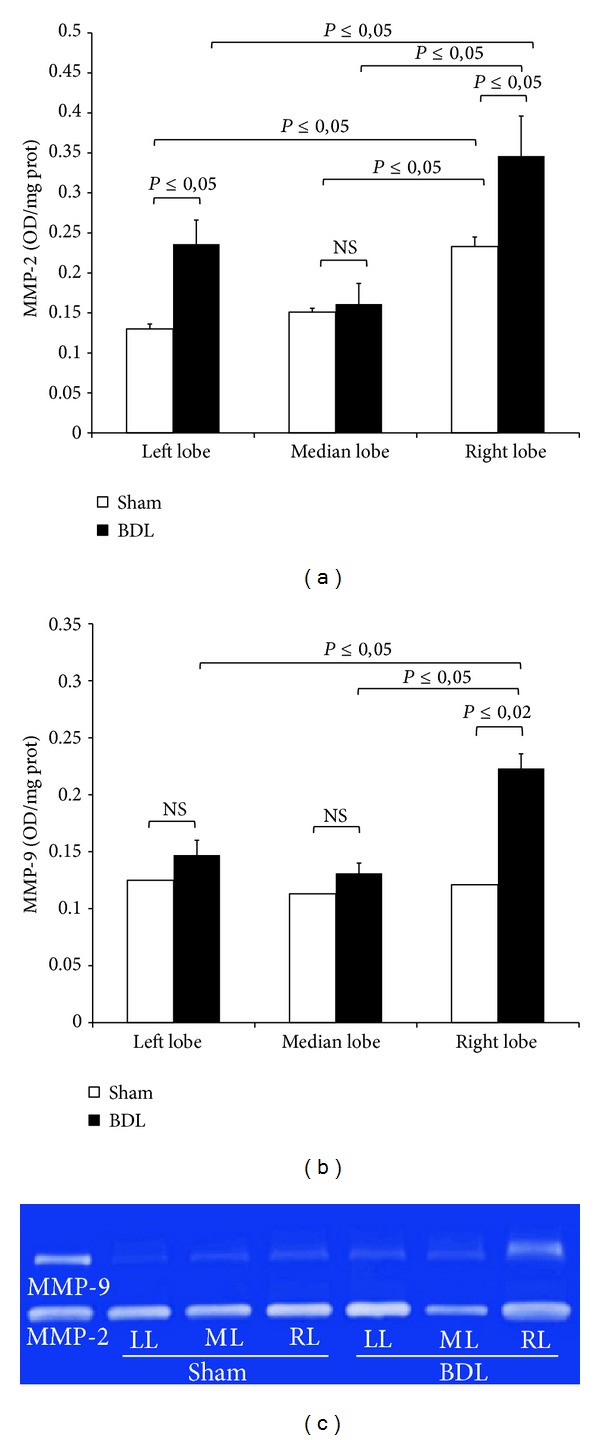
Figure 7.

Bar graphs of hepatic MMP-2 (a) and MMP-9 (b) activity and gelatin zymography (c) after 3-day BDL. Livers were submitted to BDL and left lobe (LL), median lobe (ML), and right lobe (RL) were collected. Sham-operated control animals had similar manipulation without bile duct occlusion. Gelatinase activity of MMP-2 and MMP-9 is expressed as optical density (OD) for mm2, reported to 1 mg/mL protein content. Data are shown as mean values ± ES. (c) Representative gelatin zymography in homogenized liver tissue. Lanes 1: purified MMP-2 and MMP-9 proenzyme; lanes 2, 3, and 4: tissue samples of left (L), median (M), and right (R) sham-operated rats; lanes 5, 6, and 7: tissue samples of left (L), median (M), and right (R) BDL rats.
